

Social Security COLA and Inflation: What It Means for Your Purchasing Power
The annual Social Security cost-of-living adjustment (COLA) stands as one of the most significant developments for retirees and consumers alike. It directly affects Social Security recipients by determining the size of their benefit increase in the coming year, and it also serves as a reflection of the broader inflationary environment that touches all consumers and investors. This is particularly relevant today, as inflation continues to place financial pressure on many households.
The Social Security Administration has announced a 3.6% COLA for 2027, which ranks among the highest adjustments seen in recent decades. Although this figure appears encouraging on the surface, it represents just one component of a broader strategy for preserving purchasing power in an environment of rising prices. For long-term investors, understanding what is driving inflation, how it affects cash yields, and what it means for portfolios is essential.
The 2027 COLA is shaped by elevated energy prices
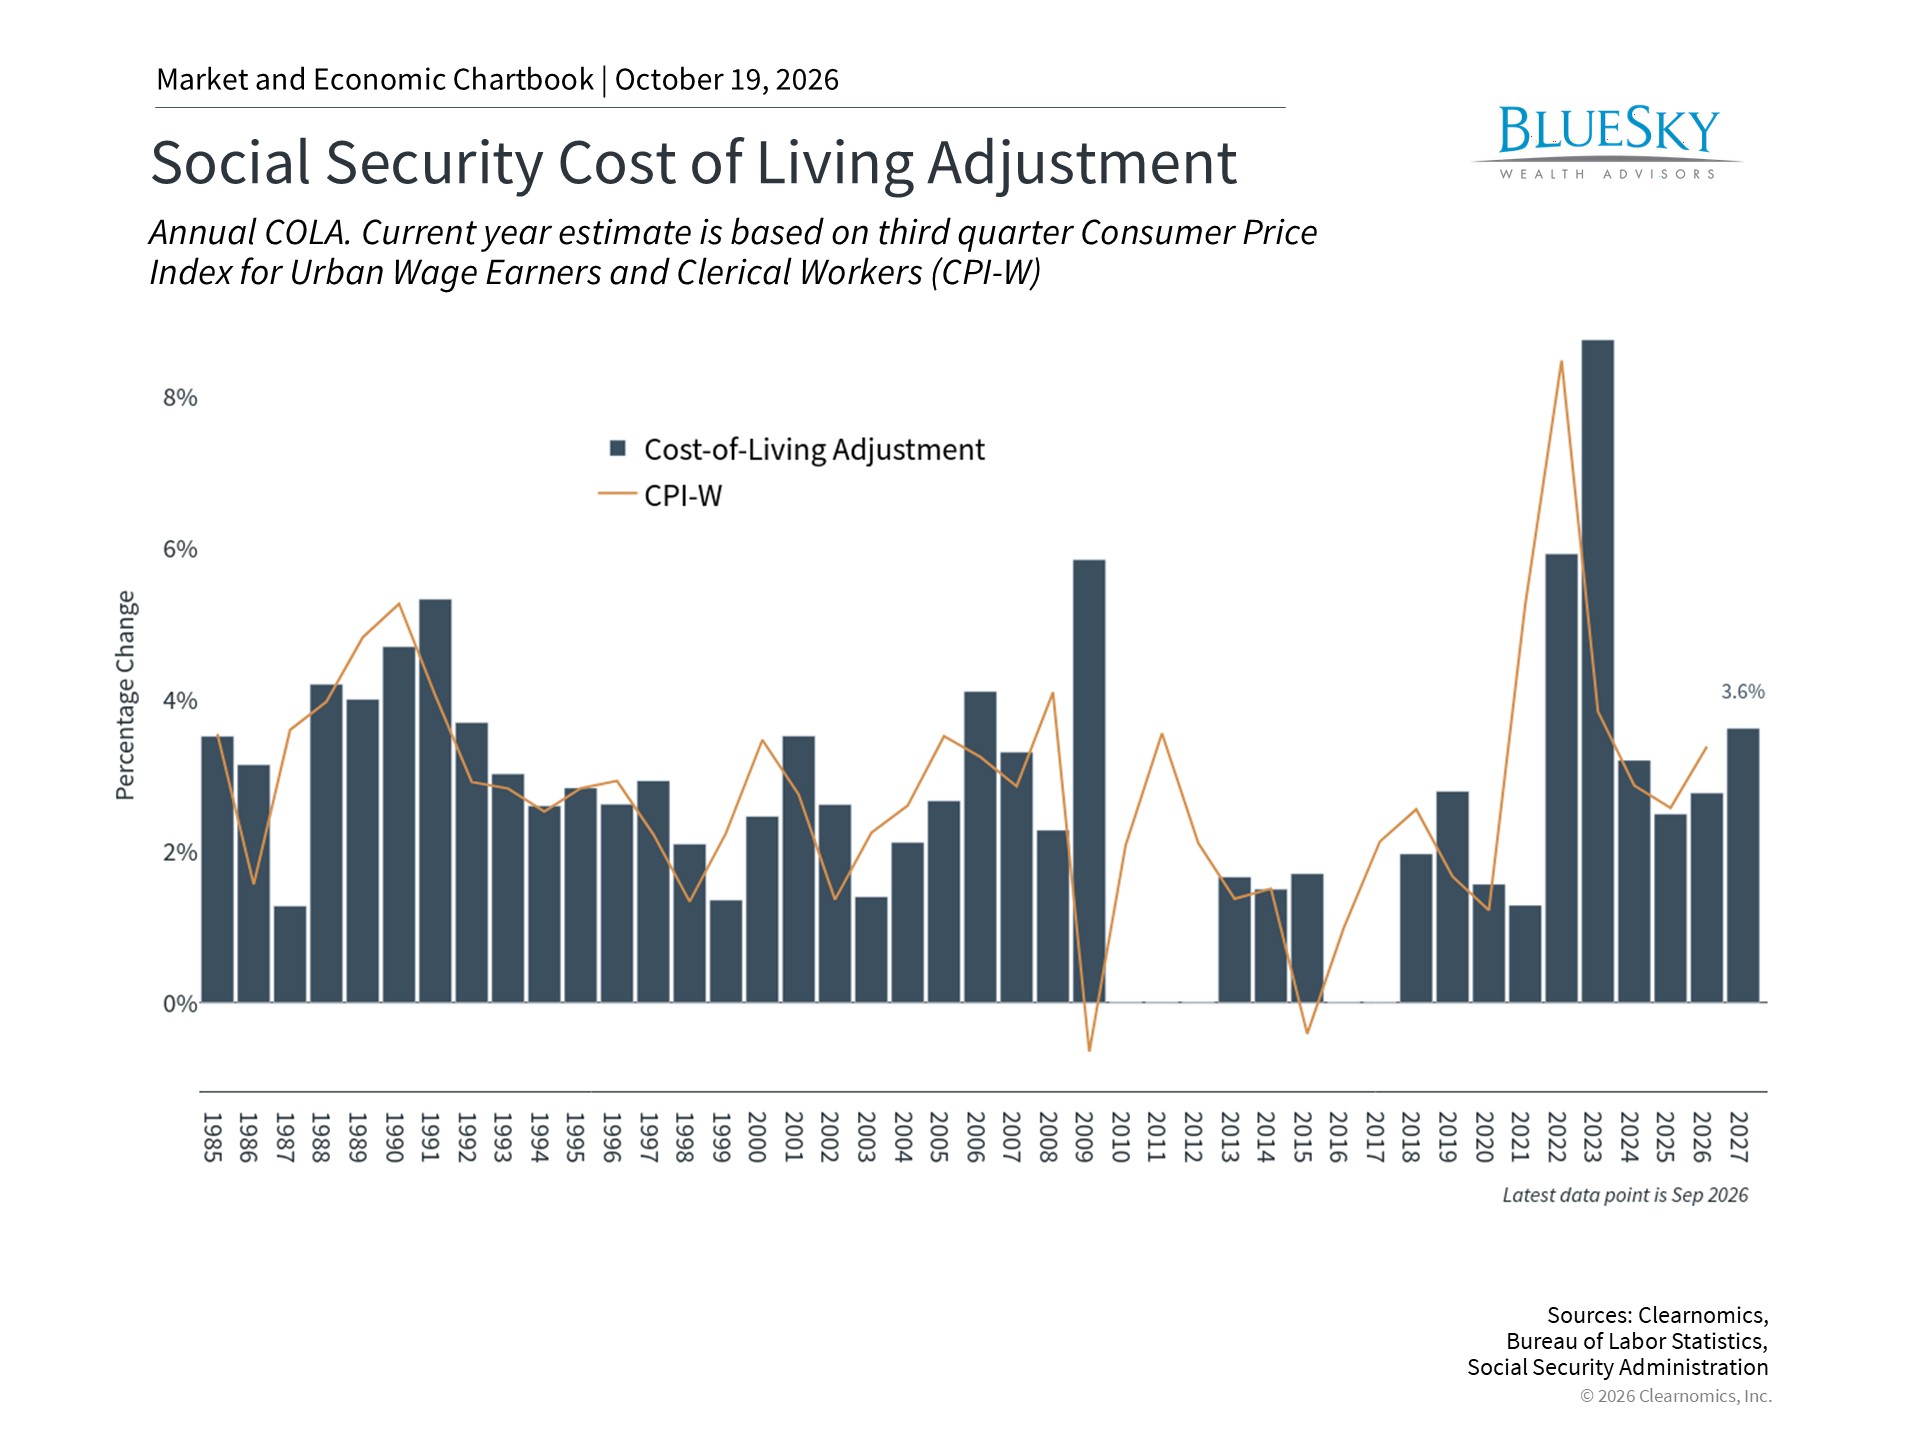
Over the past year, inflation has been shaped by two opposing forces. Broad inflationary pressures stemming from the pandemic era have eased considerably, with the Consumer Price Index decelerating from a peak of 9.1% year-over-year in 2022 to 2.7% at the start of 2026. However, rising energy prices driven by the war in Iran have pushed inflation higher in recent months, with the latest CPI reading showing that prices have increased 3.7% over the past year.1 While the overall trajectory of inflation has been encouraging, higher energy costs have added renewed pressure on consumers.
This context helps explain why the 2027 COLA of 3.6% ranks as the fifth-largest increase in more than 35 years and the highest since the 8.7% adjustment that took effect in 2023. To place this in perspective, it is also well above the 3.1% average COLA recorded over the past decade.2
COLA is calculated using a version of the Consumer Price Index known as the CPI-W, which tracks “urban wage earners and clerical workers.” This index compares price levels during the third quarter of the current year against the same period one year prior. One challenge is that a single figure cannot fully reflect the diverse needs of all retirees. For instance, the latest COLA figure means the average Social Security recipient will receive approximately $75 more per month beginning in January 2027.3 While this is a welcome development, it may not be sufficient to fully offset inflation for many retirees, particularly given rising costs for healthcare, prescription drugs, and other essential expenses.
An experimental measure known as CPI-E, or the Consumer Price Index for the Elderly, also exists as an alternative benchmark. Its purpose is to track households headed by adults aged 62 and older, and some have proposed it as a more suitable measure of spending patterns among seniors. Because seniors allocate a greater share of their income to inflation-sensitive categories such as healthcare and housing, CPI-E tends to rise more quickly than CPI-W. From January 1985 to January 2025, for example, CPI-E rose 221% while CPI-W increased 197%.4 That said, no single index can perfectly capture every household’s circumstances.
For retirees enrolled in Medicare, the monthly Part B premium, which covers outpatient care, is projected to rise by $6.60 to $209.50.5 Since this amount is typically deducted directly from Social Security checks, it may partially offset the COLA increase for those affected. Part D prescription drug plan costs are also on the rise, and while lower-cost options remain available, these increases add further complexity to the net benefit calculation. For many retirees, the actual gain in purchasing power may be smaller than the headline percentage suggests.
Consumer spending continues to underpin broad economic growth
In terms of broader economic trends, inflation continues to leave its mark across many sectors of the economy. Headline CPI rose 3.7% year-over-year in September, with gasoline prices accounting for more than half of the monthly increase, surging 9.1%. By contrast, core CPI, which excludes food and energy prices, rose only 2.6%.6
These figures suggest that energy remains the primary driver of current inflation, rather than widespread price pressures affecting the broader economy. An even narrower measure, sometimes referred to as “supercore” inflation because it excludes food, shelter, and energy, rose only 2.0%.7 Other inflation measures tell a similar story.
It is natural for elevated inflation to weigh on consumer sentiment, which has fallen to historically low levels. Despite this, many measures of consumer spending have remained resilient. Retail sales, for example, posted a notable growth rate of 6.3% over the past year in September.8 It is worth noting, however, that inflation itself contributes to this figure, as gasoline accounted for approximately 71% of the monthly increase.
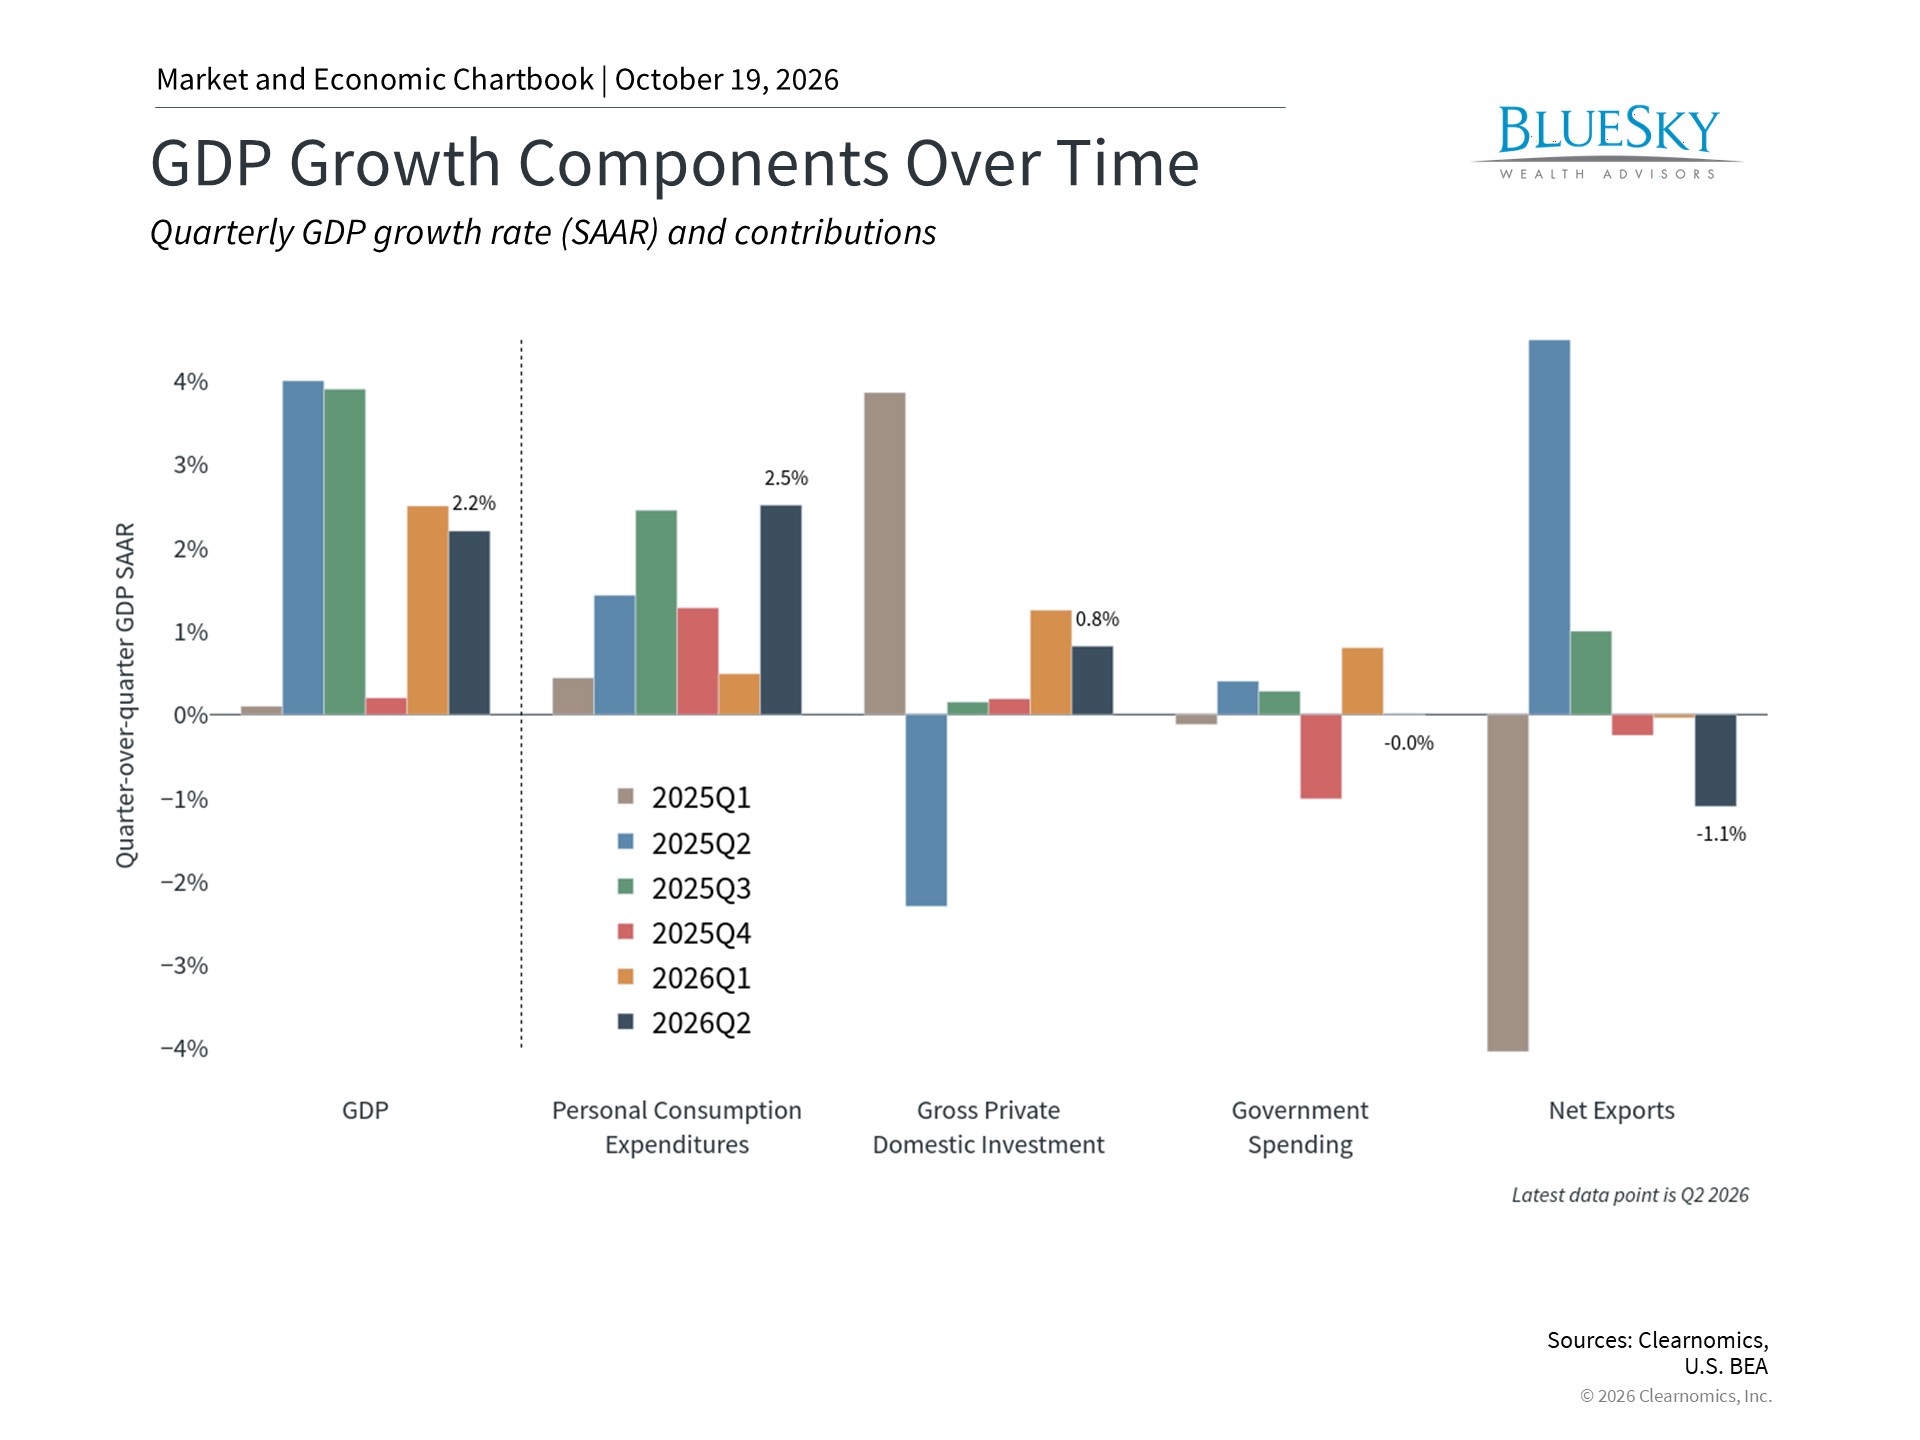
All of these factors feed into real Gross Domestic Product (GDP) growth, which is calculated to strip out the effects of inflation. Despite higher inflation and uncertainty in the labor market, consumer spending has held up well, as illustrated in the chart above.9 Business investment has also remained steady, supported in part by continued AI-related capital expenditures on data centers and infrastructure. Together, these dynamics have helped sustain broad economic growth, corporate profits, and financial markets, even as numerous challenges persist.
Cash yields continue to fall short of inflation
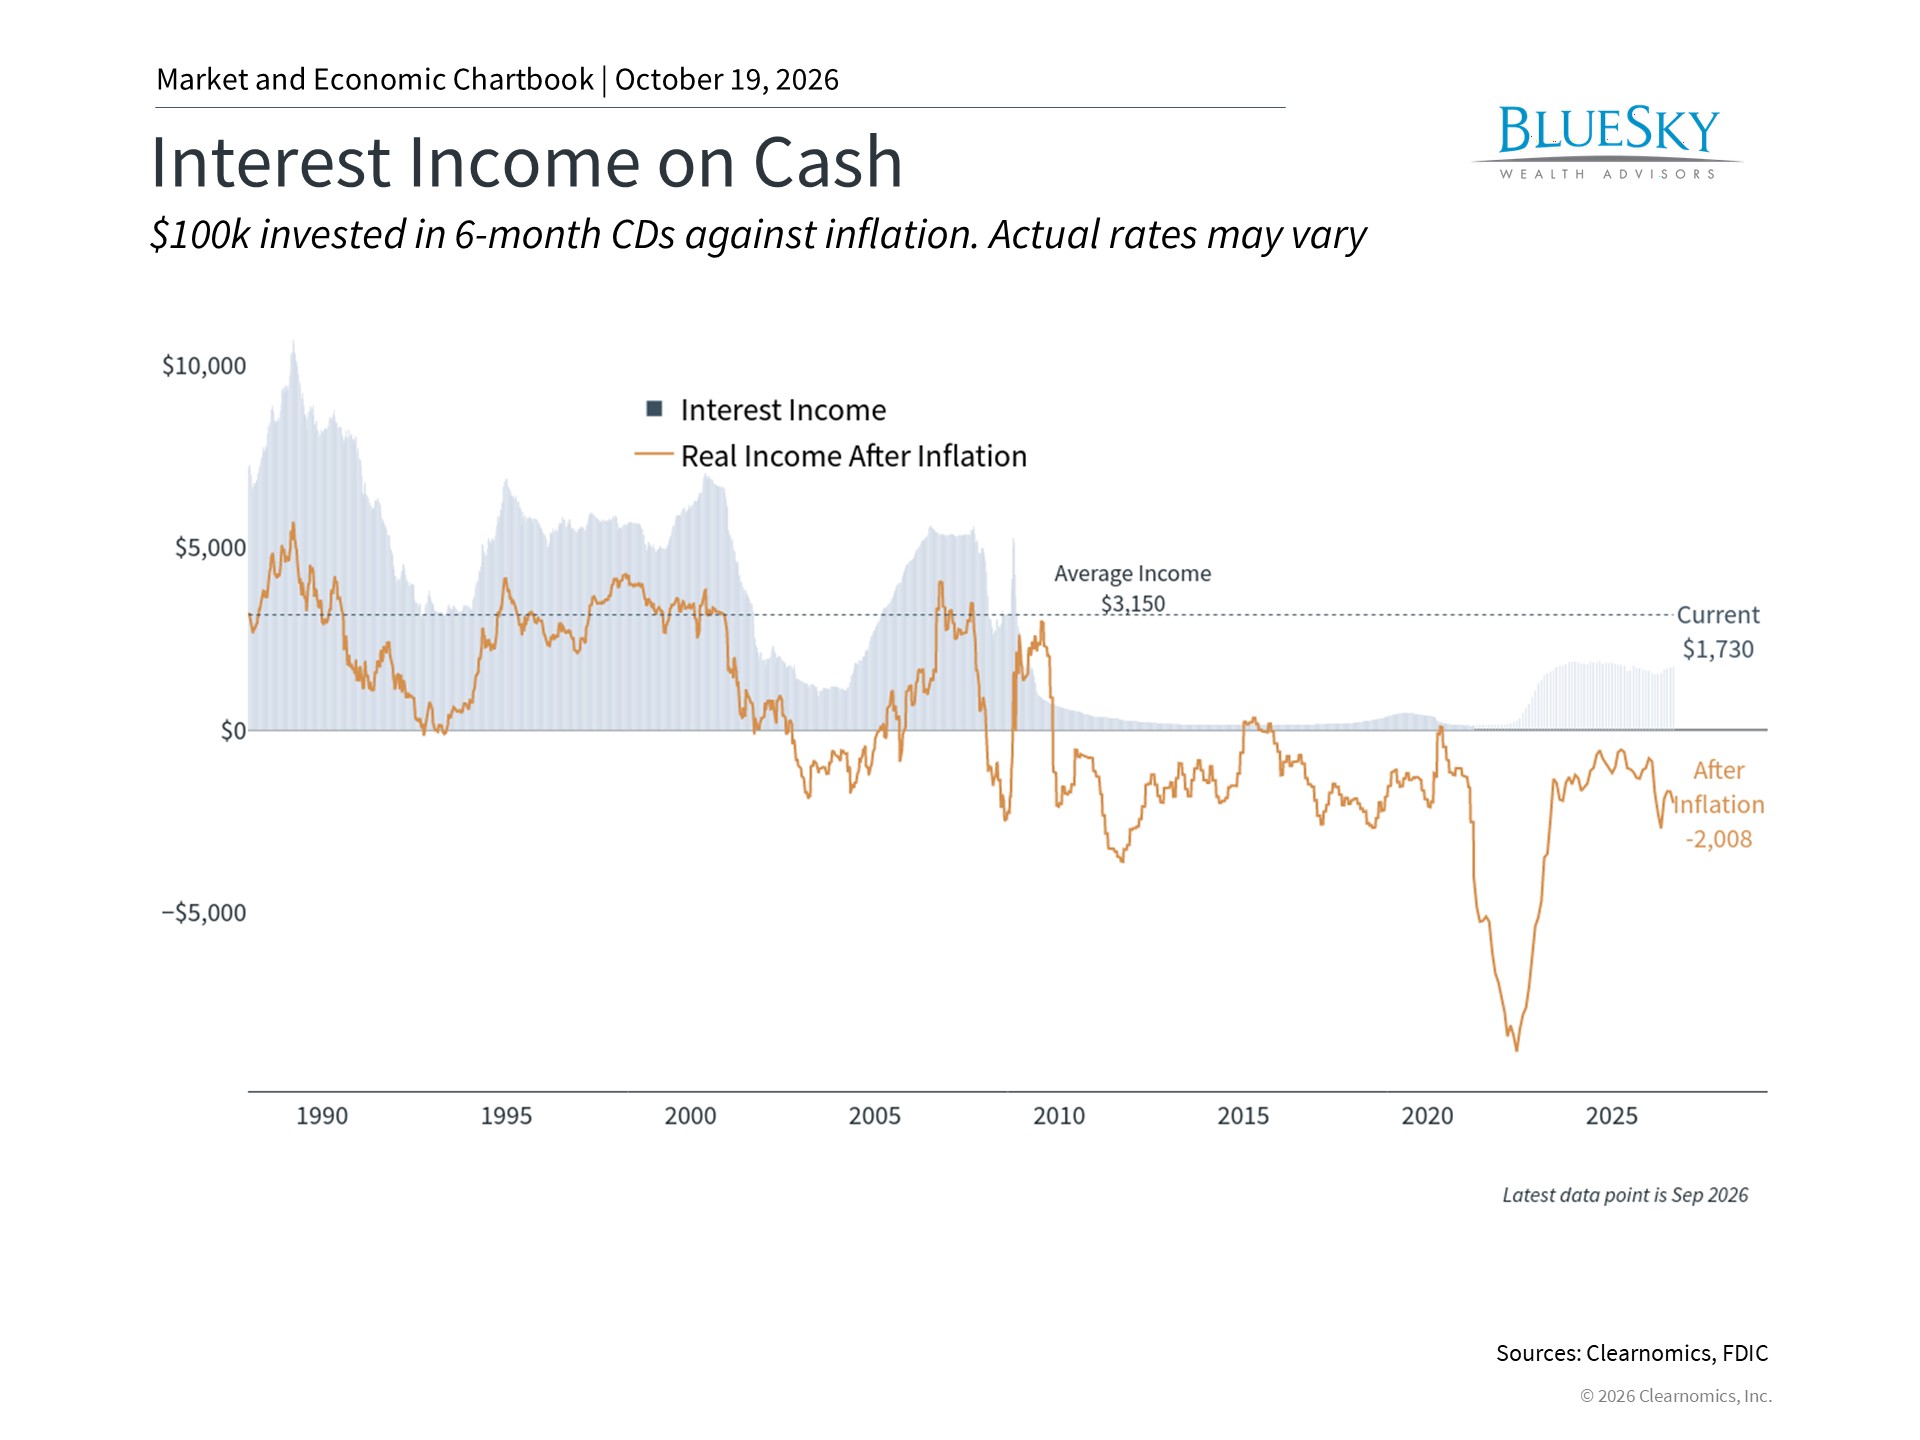
While economic growth has remained on a stable footing, the combination of inflation and elevated interest rates creates additional hurdles for long-term investors. Even though nominal interest rates are higher than they were for much of the past decade, the inflation-adjusted yields on cash remain lower than many investors might anticipate, particularly given the Federal Reserve’s rate-hiking actions.
The chart above illustrates the interest income available on cash, calculated using average yields on six-month certificates of deposit as reported by the FDIC. Although these rates are higher than in prior periods, they are still not keeping pace with inflation. Specific products and vehicles may offer above-average rates, but managing them effectively requires attention to rollover timing and ongoing monitoring of the rate environment. This means that preserving the purchasing power of savings remains a meaningful challenge, reinforcing the importance of adhering to a long-term financial plan and maintaining a portfolio capable of generating inflation-adjusted returns.
For many investors, looking beyond cash and annual benefit adjustments remains a key consideration in the effort to stay ahead of inflation. A well-structured balanced portfolio with allocations to both stocks and bonds has the potential to offer more attractive real returns than cash alone. Investment-grade corporate bonds, for example, currently offer yields that are meaningfully above their long-run historical averages.
The bottom line?
The 2027 Social Security COLA of 3.6% is a reminder that inflation remains a real challenge due to higher energy prices. Maintaining a balanced portfolio that doesn’t only rely on cash or benefit adjustments alone continues to be the best way to maintain and grow purchasing power.
References
1. https://www.bls.gov/news.release/cpi.htm
2. Clearnomics research using Social Security Administration data, as of October 18, 2026
3. https://www.ssa.gov/news/en/press/releases/2026-10-14.html
4. https://www.congress.gov/crs-product/IF12675
5. https://www.cms.gov/oact/tr/2026
6. https://www.bls.gov/news.release/cpi.htm
7. https://www.bls.gov/news.release/cpi.htm
8. Clearnomics research using U.S. Census Bureau data, as of October 18, 2026
9. Clearnomics research using BEA data, as of October 18, 2026
BlueSky Disclosures
Copyright (c) 2026 Clearnomics, Inc. All rights reserved. The information contained herein has been obtained from sources believed to be reliable, but is not necessarily complete and its accuracy cannot be guaranteed. No representation or warranty, express or implied, is made as to the fairness, accuracy, completeness, or correctness of the information and opinions contained herein. The views and the other information provided are subject to change without notice. All reports posted on or via www.clearnomics.com or any affiliated websites, applications, or services are issued without regard to the specific investment objectives, financial situation, or particular needs of any specific recipient and are not to be construed as a solicitation or an offer to buy or sell any securities or related financial instruments. Past performance is not necessarily a guide to future results. Company fundamentals and earnings may be mentioned occasionally, but should not be construed as a recommendation to buy, sell, or hold the company’s stock. Predictions, forecasts, and estimates for any and all markets should not be construed as recommendations to buy, sell, or hold any security–including mutual funds, futures contracts, and exchange traded funds, or any similar instruments. The text, images, and other materials contained or displayed in this report are proprietary to Clearnomics, Inc. and constitute valuable intellectual property. All unauthorized reproduction or other use of material from Clearnomics, Inc. shall be deemed willful infringement(s) of this copyright and other proprietary and intellectual property rights, including but not limited to, rights of privacy. Clearnomics, Inc. expressly reserves all rights in connection with its intellectual property, including without limitation the right to block the transfer of its products and services and/or to track usage thereof, through electronic tracking technology, and all other lawful means, now known or hereafter devised. Clearnomics, Inc. reserves the right, without further notice, to pursue to the fullest extent allowed by the law any and all criminal and civil remedies for the violation of its rights.