Our financial plan and investment strategy align your goals to create a custom path to your desired quality of life. We’ll boost your progress toward savings and retirement goals, diversify your portfolio, and optimize your business’s cash flow. Our goal is to empower you with confidence in your future.
Join BlueSky Wealth Advisors for an insightful session that will equip you with the knowledge and strategies you need to navigate the shifting landscape of retirement plan taxation. In light of the SECURE Act’s sweeping changes, understanding who ultimately shoulders the tax burden, and how you can optimize your own plan, is more critical than ever.
What You’ll Learn
Retirement Plans in Distribution: How changes under the SECURE Act have adjusted the balance of taxes between owners and beneficiaries.
Are Roth conversions a good strategy for tax avoidance? Measuring the effectiveness of tax avoidance with Roth conversions leads to some surprising results.
You’ll come away from the webinar with a clearer understanding of what retirement plans in distribution look like, and what you can do to minimize the taxes you – and possibly your heirs – will pay from your IRA.
Natural disasters require different preparation strategies – while earthquakes demand immediate response plans, erosion calls for long-term protective measures. Financial challenges follow similar patterns. The most significant threats to household and business finances aren’t always sudden market crashes but can unfold gradually over extended periods. Today’s inflationary pressures exemplify this, presenting both immediate price spikes and the persistent decline of purchasing power that impacts investment markets.
Investors familiar with the inflationary periods of the 1970s and early 1980s, or those who experienced post-pandemic price increases, recognize these dynamics. Current inflation remains more persistent than desired, with ongoing concerns that tariffs could drive consumer prices higher. Simultaneously, this inflation coincides with robust employment levels, strong consumer spending, and solid corporate earnings. This combination creates a challenging landscape for investors and policymakers attempting to balance economic growth with price stability.
Instead of waiting for inflation to become problematic, prudent long-term investors should construct portfolios capable of weathering various economic scenarios while maintaining focus on their financial objectives. What insights do current inflation data provide about economic conditions and investment strategies?
The gradual erosion of purchasing power through inflation
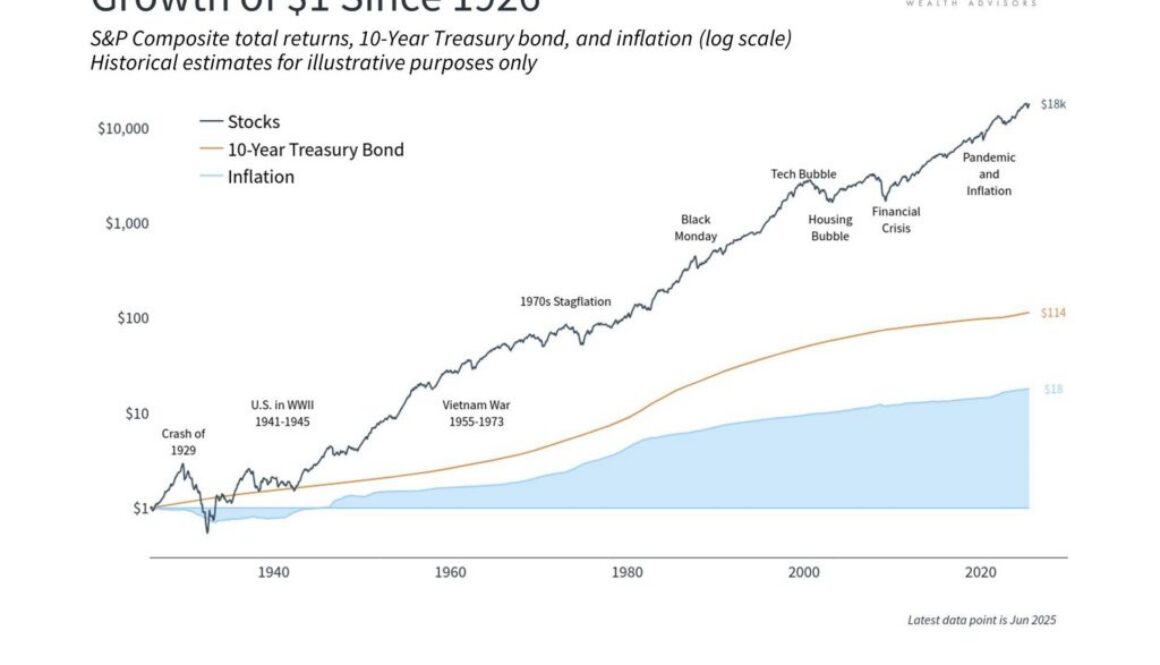
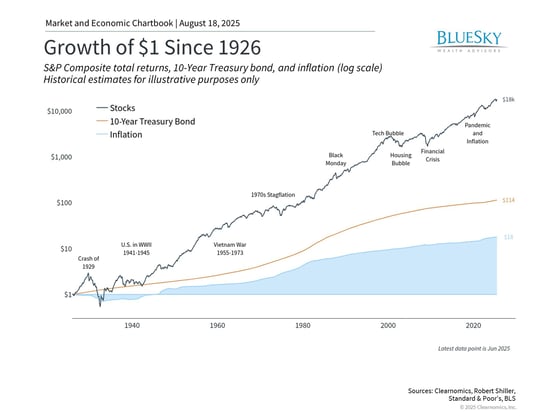
The fundamental purpose of investing for most individuals, savers, and retirees centers on preserving purchasing power against inflation’s effects. Whether through equities, fixed income, certificates of deposit, or alternative investments, maintaining the real value of portfolios and bank deposits remains essential for securing future financial comfort. The accompanying chart demonstrates this reality starkly. Items costing $1 one hundred years ago now require $18. The data also reveals acceleration in these price pressures during the 1970s and again in recent years.
This perspective might suggest that zero inflation – or deflation where prices decline – would benefit consumers. However, inflation encompasses more than individual costs; it reflects broader economic health. Contemporary economic theory supports maintaining low but positive inflation rates, typically around 2%, as optimal for both individuals and the overall economy.
Moderate inflation levels provide central banks flexibility in conducting monetary policy, encouraging spending and investment when conditions warrant. Furthermore, modest inflation helps prevent deflationary cycles, where declining prices cause consumers to postpone purchases in anticipation of further price reductions.
Therefore, distinguishing between individual and macroeconomic viewpoints proves crucial. While 2-3% inflation may historically support healthy growth environments, even these moderate levels can harm savers. Though these rates appear manageable compared to 1970s double-digit inflation or recent post-pandemic surges, they still compound significantly over time.
Consider that 3% annual inflation doubles costs approximately every 24 years. This means $100,000 in current purchasing power would require $200,000 in two decades – well within typical retirement spans. This erosion particularly challenges retirees and cash holders. For all investors, inflation establishes a “hurdle rate” that investment returns must exceed to build real wealth.
Persistent inflationary pressures continue
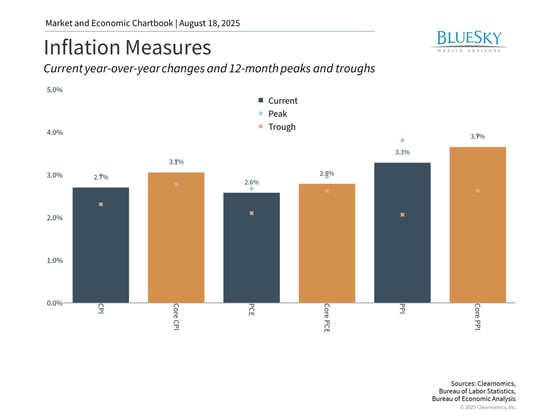
Regarding today’s inflationary climate, many worry about the sudden impact tariffs might have on price levels. Recent Producer Price Index data illustrates this concern, showing business-charged prices surged in July. Wholesale prices jumped 0.9%, marking the largest monthly increase since June 2022 and significantly exceeding economist expectations. Goods prices climbed 0.7% during this period, while services surged 1.1% in a single month.1
These figures matter because wholesale price increases typically appear in consumer prices with several months’ delay as inflation moves through supply chains. This pattern suggests companies have absorbed some tariff costs thus far but may begin transferring higher prices to customers.
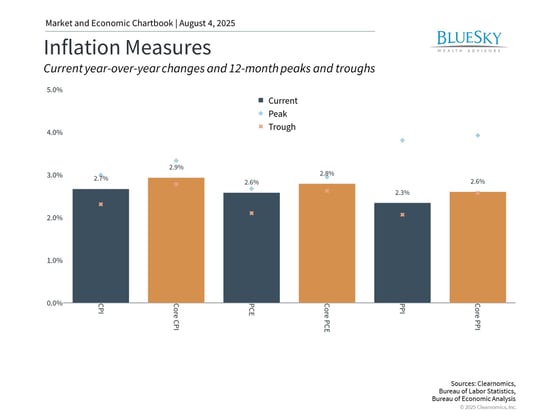
Recent Consumer Price Index data shows less dramatic increases but confirms inflation’s persistence beyond desired levels. Latest figures indicate prices rose 2.7% annually for headline inflation, or 3.1% excluding food and energy prices, which remained flat or declined. Much of this increase stemmed from rising shelter costs, particularly housing expenses.2
Beyond abstract economic understanding, these numbers directly affect household budgets. Price increases appear where consumers notice them most: restaurant meals increased 3.9% annually, medical care rose 3.5%, and car insurance jumped 5.3%. Even household items like furniture climbed 3.4%, adding pressure to family budgets already strained by years of elevated prices.
Strategic asset allocation essential for inflation protection
While these increases are significant, inflation remains well below the double-digit rates experienced from 2021 to 2022. Nevertheless, even without tariff-induced price spikes, they may elevate average price levels over time, diminishing cash value. This proves especially problematic when wage growth lags price increases and investors lack long-term allocations capable of exceeding inflation rates.
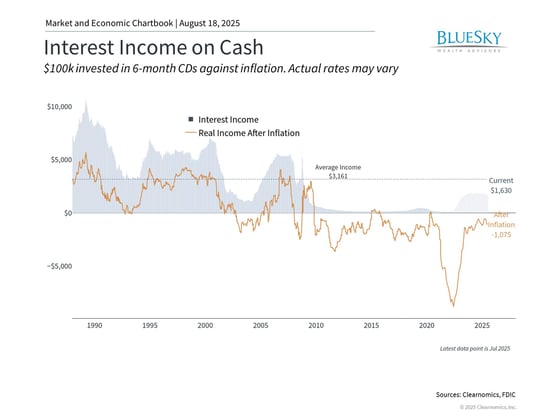
Understanding inflation’s portfolio implications remains vital. The chart above illustrates that average cash interest rates have failed to match inflation levels. Additionally, money market fund holdings remain at record highs of $7.1 trillion, despite declining short-term interest rates.3
While past performance doesn’t guarantee future results, historical data shows both stocks and bonds have surpassed inflation over extended periods, as the first chart demonstrates. However, equities can experience volatility during inflationary periods, as seen in 2022. This explains why balanced asset class allocation capable of withstanding both inflation and market volatility helps investors maintain course.
Most importantly, investors should avoid making dramatic portfolio adjustments based on monthly inflation reports or tariff concerns. While ensuring portfolios are positioned for various scenarios remains crucial, overreacting to short-term data frequently results in poor timing decisions that can undermine long-term financial objectives.
The bottom line? Inflation’s steady erosion of purchasing power represents a fundamental investment challenge. Maintaining a well-balanced portfolio designed to generate both income and growth provides the optimal path toward achieving financial goals.
https://www.bls.gov/news.release/ppi.nr0.htm
https://www.bls.gov/news.release/cpi.t01.htm
https://www.ici.org/research/stats/mmf
BlueSky Disclosures
Copyright (c) 2025 Clearnomics, Inc. All rights reserved. The information contained herein has been obtained from sources believed to be reliable, but is not necessarily complete and its accuracy cannot be guaranteed. No representation or warranty, express or implied, is made as to the fairness, accuracy, completeness, or correctness of the information and opinions contained herein. The views and the other information provided are subject to change without notice. All reports posted on or via www.clearnomics.com or any affiliated websites, applications, or services are issued without regard to the specific investment objectives, financial situation, or particular needs of any specific recipient and are not to be construed as a solicitation or an offer to buy or sell any securities or related financial instruments. Past performance is not necessarily a guide to future results. Company fundamentals and earnings may be mentioned occasionally, but should not be construed as a recommendation to buy, sell, or hold the company’s stock. Predictions, forecasts, and estimates for any and all markets should not be construed as recommendations to buy, sell, or hold any security–including mutual funds, futures contracts, and exchange traded funds, or any similar instruments. The text, images, and other materials contained or displayed in this report are proprietary to Clearnomics, Inc. and constitute valuable intellectual property. All unauthorized reproduction or other use of material from Clearnomics, Inc. shall be deemed willful infringement(s) of this copyright and other proprietary and intellectual property rights, including but not limited to, rights of privacy. Clearnomics, Inc. expressly reserves all rights in connection with its intellectual property, including without limitation the right to block the transfer of its products and services and/or to track usage thereof, through electronic tracking technology, and all other lawful means, now known or hereafter devised. Clearnomics, Inc. reserves the right, without further notice, to pursue to the fullest extent allowed by the law any and all criminal and civil remedies for the violation of its rights.
Today’s investors face a compelling question: not whether artificial intelligence will reshape our economy, but how to preserve portfolio equilibrium while markets reach unprecedented peaks. Though the allure of concentrating on recently successful companies is strong, achieving long-term financial objectives demands a balanced approach that weighs both growth potential and risk considerations.
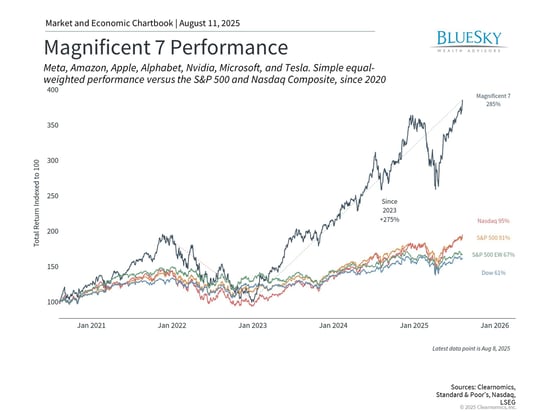
Technology giants capitalizing on AI developments are frequently grouped under the “Magnificent 7” umbrella. This collection—Apple, Microsoft, Nvidia, Amazon, Alphabet, Meta, and Tesla—currently accounts for approximately 35% of S&P 500 market value and includes seven of the eight most valuable corporations. Many earn the “hyperscaler” designation through their substantial computing infrastructure investments designed to support expanding AI application requirements.
During market phases where a limited number of stocks propel overall performance, historical context, present valuations, and strategic asset allocation become increasingly crucial. Examining how comparable concentration periods unfolded previously can guide investors toward more informed long-term financial planning decisions.
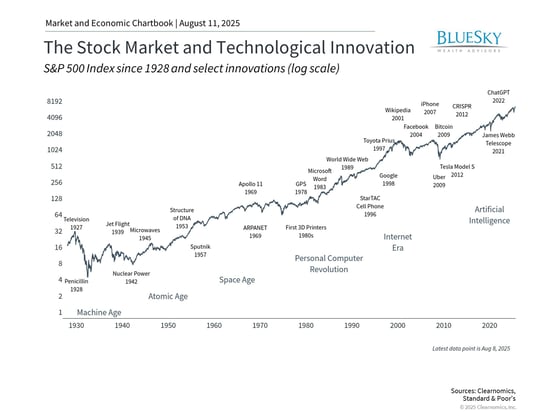
While AI and railroad development might appear unrelated, history reveals that revolutionary technologies typically follow comparable trajectories. During the 1860s, railroad securities commanded American markets similarly to how technology shares dominate today. The Pennsylvania Railroad once held the distinction of being the world’s largest corporation and, together with other rail companies, comprised a substantial portion of total market capitalization. This naturally generated investor excitement and escalating valuations that contemporary investors would recognize.
This cycle has recurred throughout different eras. The 1990s dot-com surge, when investors concentrated almost entirely on internet enterprises, offers perhaps the most relevant recent illustration. Yet stretching back to the 1800s, telegraph systems, electrical power, and telephone networks revolutionized urban centers while spawning numerous enterprises. Throughout the 1900s, electronics and computing advances transformed every aspect of society and commerce, even preceding internet development.
These technological waves shared common characteristics: initial doubt, swift acceptance, market fervor, and ultimate absorption into the wider economy. Railroad networks didn’t vanish but evolved into standard transportation and logistics infrastructure supporting overall economic activity. Although numerous dot-com ventures collapsed during the late 1990s and early 2000s, many others evolved into today’s technology frontrunners.
Regarding long-term investment strategy, attention should encompass not merely individual corporations but new technologies’ influence on broader markets and economic systems. The genuine impact of innovation lies in enhanced productivity and efficiency across all business sectors. The crucial distinction is that while specific company stock prices may fluctuate rapidly, comprehensive economy-wide effects require considerably more time to materialize.
Currently, the question centers not on AI’s eventual importance but whether existing valuations reflect reasonable expectations. With the S&P 500 trading at 22.5x price-to-earnings multiples—approaching the record 24.5x peak—investors are accepting premiums that presume these developments will maintain their current trajectory.
What factors contribute to elevated Magnificent 7 valuations? Initially, recent projections indicate U.S. private AI investment reached $109 billion in 2024, with hundreds of billions more committed this year. This amount surpasses entire national GDPs and significantly exceeds comparable international investments. Recent quarters have witnessed positive investor responses to announcements of increasingly substantial AI infrastructure expenditures. This represents a notable change from less than twelve months ago when investors questioned whether these corporate investments would generate returns.
Additionally, widespread AI tool adoption by businesses and consumers has created escalating computing power demand. This explains why “hyperscalers” such as Microsoft and NVIDIA have experienced soaring market capitalizations, with both reaching valuations exceeding $4 trillion. This also accounts for why new data center requirements and their power consumption remain investor priorities.
These corporations are perceived as constructing infrastructure enabling other businesses to embrace AI technologies, similar to how railroad companies built transportation networks supporting all 19th-century enterprises. While this generates substantial long-term value, return realization timelines remain unpredictable.
The difficulty lies in markets frequently overestimating the pace at which transformative technologies will produce profits, even when long-term potential appears genuine. The 1990s provide a relevant cautionary example. During that period, some investors believed conventional valuation measures no longer applied to internet companies. When reality failed to meet expectations, the Nasdaq declined 78% from its peak, resulting in numerous company failures or acquisitions. Nevertheless, the internet did transform the economy, just not within the timeframe or manner that peak valuations suggested.
Managing opportunities while addressing concentration risk
Likewise, while the Magnificent 7 companies may have spearheaded market advances, they have similarly led declines. During 2022, when interest rates increased rapidly due to inflation, these securities fell approximately 50% on average.
Given that the Magnificent 7 now constitutes such a significant portion of major market indices, virtually all investors hold these stocks within their portfolios. Those who have emphasized technology securities may discover their portfolio allocations exceed intended levels.
Maintaining excessive portfolio concentration in limited investments is commonly termed “concentration risk” and represents the antithesis of diversification. While these companies have demonstrated growth and profitability, having substantial portfolio portions dependent on a small company group—regardless of their success—can generate volatility as trends shift. Even exceptional companies can experience underperformance periods.
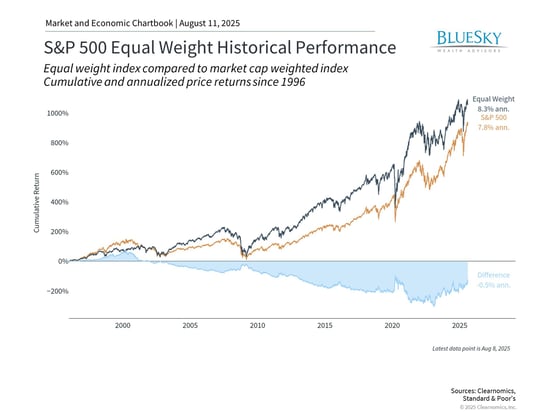
For context, consider the equal-weighted S&P 500 illustrated in the accompanying chart, which assigns identical importance to each company irrespective of size. This methodology has historically delivered different return patterns compared to standard market-capitalization weighted indices, sometimes outperforming when large companies face difficulties.
Since mega-cap technology companies have recently performed well, some investors may find it unexpected that an equal-weighted index has still delivered superior performance over the past 30 years. This underscores the importance of looking beyond recent market drivers and current headlines.
This doesn’t suggest investors should completely avoid technology stocks. Instead, it emphasizes maintaining balance and appropriate asset allocation importance.
The bottom line? Current AI developments present both opportunities and risks for investors. Financial success stems not from selecting winning stocks but from maintaining proper portfolio balance aligned with long-term objectives.
BlueSky Disclosures
Copyright (c) 2025 Clearnomics, Inc. All rights reserved. The information contained herein has been obtained from sources believed to be reliable, but is not necessarily complete and its accuracy cannot be guaranteed. No representation or warranty, express or implied, is made as to the fairness, accuracy, completeness, or correctness of the information and opinions contained herein. The views and the other information provided are subject to change without notice. All reports posted on or via www.clearnomics.com or any affiliated websites, applications, or services are issued without regard to the specific investment objectives, financial situation, or particular needs of any specific recipient and are not to be construed as a solicitation or an offer to buy or sell any securities or related financial instruments. Past performance is not necessarily a guide to future results. Company fundamentals and earnings may be mentioned occasionally, but should not be construed as a recommendation to buy, sell, or hold the company’s stock. Predictions, forecasts, and estimates for any and all markets should not be construed as recommendations to buy, sell, or hold any security–including mutual funds, futures contracts, and exchange traded funds, or any similar instruments. The text, images, and other materials contained or displayed in this report are proprietary to Clearnomics, Inc. and constitute valuable intellectual property. All unauthorized reproduction or other use of material from Clearnomics, Inc. shall be deemed willful infringement(s) of this copyright and other proprietary and intellectual property rights, including but not limited to, rights of privacy. Clearnomics, Inc. expressly reserves all rights in connection with its intellectual property, including without limitation the right to block the transfer of its products and services and/or to track usage thereof, through electronic tracking technology, and all other lawful means, now known or hereafter devised. Clearnomics, Inc. reserves the right, without further notice, to pursue to the fullest extent allowed by the law any and all criminal and civil remedies for the violation of its rights.
Investors seeking to decode the current economic landscape face a challenging array of conflicting signals. Recent employment figures revealed disappointing job creation alongside significant downward revisions to prior months, prompting President Trump to dismiss the Bureau of Labor Statistics commissioner. Meanwhile, GDP growth showed renewed strength in the second quarter, and corporate earnings continue surpassing forecasts, propelling markets to record levels. Yet concerns persist around tariffs and persistent inflation pressures.
Such contradictory information creates a complex environment for both investors and policymakers, complicating financial decision-making when the underlying data itself faces scrutiny.
The challenge extends beyond today’s mixed signals to a fundamental reality: economic analysis requires far more than monitoring a handful of key metrics. Effective interpretation demands understanding multiple dimensions including employment trends, price pressures, productivity measures, government spending patterns, and numerous other factors.
Instead of responding hastily to individual data releases, prudent investing demands understanding how to weigh different indicators and identify underlying patterns. Given today’s economic uncertainty, which metrics deserve investors’ attention as they navigate portfolio management and long-term planning?
Employment data highlights economic vulnerabilities
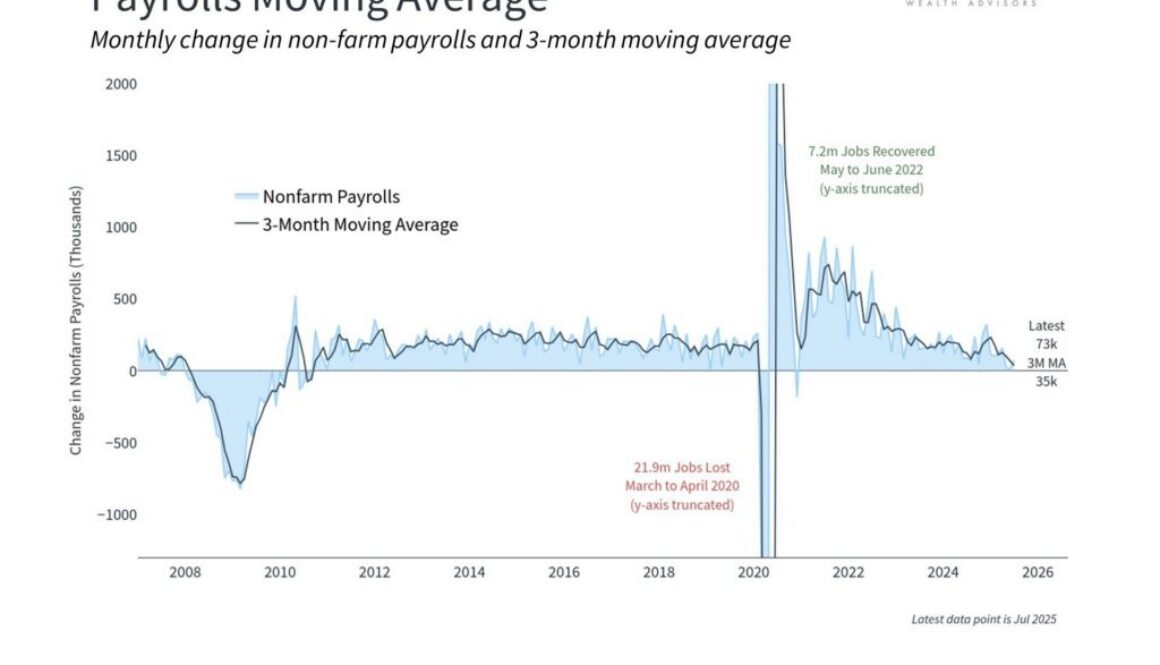
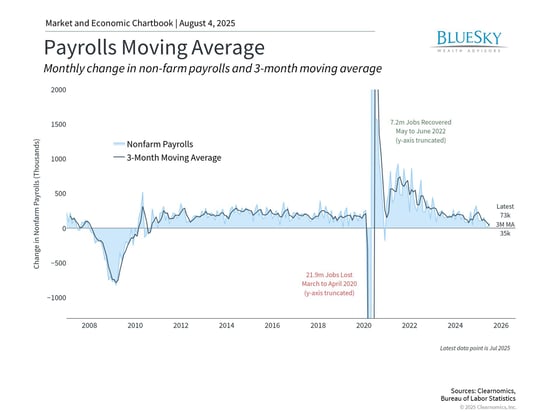
July’s employment report delivered concerning news with just 73,000 new positions created, falling short of analyst projections. More troubling were the substantial downward adjustments to May and June data, collectively reducing previously reported job gains by 258,000. These revisions indicate the economic expansion was considerably weaker in recent months than initially calculated.
Such significant adjustments have intensified questions about government statistics’ credibility. This presents a serious challenge since official data provides the bedrock for economic analysis. From employment metrics produced by the Bureau of Labor Statistics to GDP measurements from the Bureau of Economic Analysis and inflation readings from various federal agencies, these figures inform Federal Reserve decisions and investment strategies alike.
Given today’s polarized political atmosphere, data reliability carries heightened importance. Understanding several fundamental principles becomes essential.
Government statistics underpin financial market decisions
Why does this matter? Some measurements can be precisely determined. Individual company headcounts, specific layoff numbers, or particular wage increases can be calculated with high accuracy. However, aggregating such figures across millions of businesses and hundreds of millions of workers makes exact counting both impractical and potentially impossible. Statistical sampling and estimation become necessary.
Government statistics, like all statistical measures, contain inherent imperfections. These figures derive from surveys covering thousands of enterprises and households, conducted by trained data collectors and analyzed by professional statisticians and economists. The quality depends entirely on survey design and methodology, meaning results should be interpreted as estimates rather than precise counts.
A fundamental tension exists between speed, which markets and policymakers demand, and accuracy, which requires additional time and information. Official economic releases follow rigid timetables and undergo multiple revisions as fresh data emerges. This revision process strengthens the system by enabling ongoing accuracy improvements. However, it means individual figures should never be treated as definitive.
Notwithstanding these constraints, U.S. official data maintains its industry reputation as the global benchmark compared to other nations. These organizations uphold rigorous standards and provide primary sources for numerous indicators. While methodologies can always improve (and frequently do), the agencies employ professionals who have served across multiple political administrations.
Tension between politics and economic data remains inevitable since strong incentives exist to present favorable economic conditions, while proving political manipulation in reports proves extremely difficult. This dynamic has persisted across various political environments.
These complexities make examining multiple perspectives essential, incorporating both official and private data sources to develop clearer economic understanding. Investment research commonly employs “mosaic theory,” where diverse information pieces combine to create comprehensive pictures. Employment figures, growth metrics, inflation measures, corporate profits, and consumer expenditure data from various sources each contribute valuable insights.
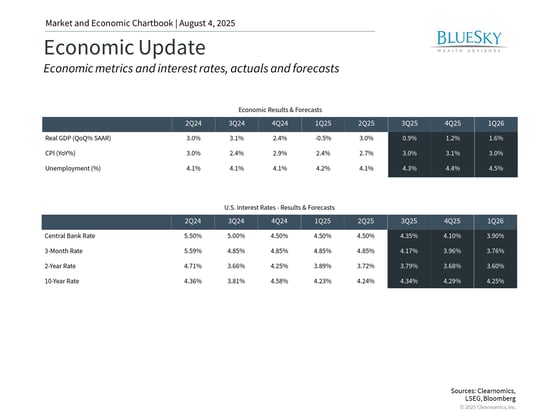
Much economic research focuses on determining which indicators matter most, their relative importance, and optimal timing. While recent employment data disappointed expectations, alternative metrics suggest overall economic output continues expanding at healthy rates. Second quarter GDP growth accelerated to 3.0%, significantly exceeding long-term averages and reversing first quarter weakness.
Tariffs represent a significant unknown factor and help explain divergent economic perspectives. Inflation hasn’t surged dramatically as some anticipated, yet remains persistently above the Federal Reserve’s 2% objective.
Nevertheless, early indicators suggest tariffs may be influencing consumer prices. Recent Consumer Price Index data shows accelerating inflation for everyday goods even as service sector price pressures moderate. Additionally, the latest Personal Consumption Expenditures figures reveal inflation rising to 2.6% in June compared to the previous year.
For investors, economic indicators frequently point in different directions and sometimes appear contradictory. This stems from both economic uncertainty and measurement difficulties. Ultimately, the economy’s longer-term trajectory matters most for investment decisions, and utilizing diverse data sources proves essential for understanding the complete picture.
The bottom line? Recent employment reports have sparked concerns about official data reliability. Investors must grasp both the utility and limitations of such information. Maintaining broader perspectives through multiple data sources represents the most effective approach for sound long-term investment choices.
BlueSky Disclosures
Copyright (c) 2025 Clearnomics, Inc. All rights reserved. The information contained herein has been obtained from sources believed to be reliable, but is not necessarily complete and its accuracy cannot be guaranteed. No representation or warranty, express or implied, is made as to the fairness, accuracy, completeness, or correctness of the information and opinions contained herein. The views and the other information provided are subject to change without notice. All reports posted on or via www.clearnomics.com or any affiliated websites, applications, or services are issued without regard to the specific investment objectives, financial situation, or particular needs of any specific recipient and are not to be construed as a solicitation or an offer to buy or sell any securities or related financial instruments. Past performance is not necessarily a guide to future results. Company fundamentals and earnings may be mentioned occasionally, but should not be construed as a recommendation to buy, sell, or hold the company’s stock. Predictions, forecasts, and estimates for any and all markets should not be construed as recommendations to buy, sell, or hold any security–including mutual funds, futures contracts, and exchange traded funds, or any similar instruments. The text, images, and other materials contained or displayed in this report are proprietary to Clearnomics, Inc. and constitute valuable intellectual property. All unauthorized reproduction or other use of material from Clearnomics, Inc. shall be deemed willful infringement(s) of this copyright and other proprietary and intellectual property rights, including but not limited to, rights of privacy. Clearnomics, Inc. expressly reserves all rights in connection with its intellectual property, including without limitation the right to block the transfer of its products and services and/or to track usage thereof, through electronic tracking technology, and all other lawful means, now known or hereafter devised. Clearnomics, Inc. reserves the right, without further notice, to pursue to the fullest extent allowed by the law any and all criminal and civil remedies for the violation of its rights.
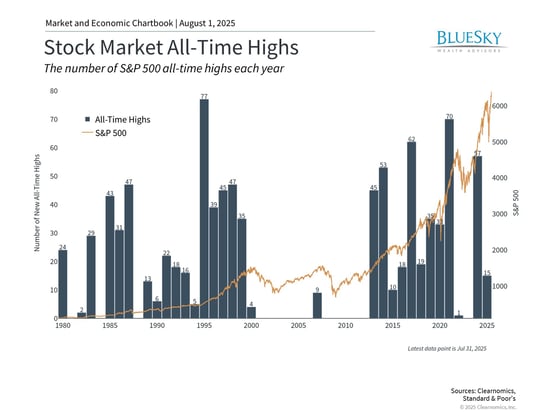
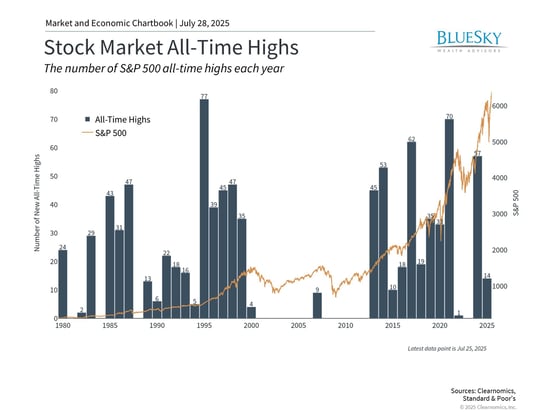
July witnessed the S&P 500 achieving ten fresh record highs, driven by robust earnings reports, steady economic indicators, and successful trade negotiations completed before the tariff implementation date. The index closed at record levels for six straight sessions during the month’s latter half, contributing to a 7.8% year-to-date advance for the S&P 500.
Nevertheless, market volatility and economic uncertainties emerged as July concluded. The July 31 tariff rate announcement sparked worries about potential consumer price increases. Moreover, employment data from July indicated that job market conditions had been significantly weaker during the prior three-month period than initially reported.
Given these circumstances, investors should maintain composure while markets digest fresh trade policy developments and economic information. Recent months demonstrate how rapidly conditions can shift, reinforcing that maintaining long-term investment focus remains the most effective approach for reaching financial objectives.
Primary Market and Economic Factors
July performance showed the S&P 500 advancing 2.2%, the Dow Jones Industrial Average climbing 0.1%, and the Nasdaq increasing 3.7%. For the year, the S&P 500 has risen 7.8%, the Dow has gained 3.7%, and the Nasdaq has advanced 9.4%.
Bond markets saw the Bloomberg U.S. Aggregate Bond Index fall 0.3% during July. The 10-year Treasury yield increased modestly to close the month at 4.38%.
Global equity markets showed mixed results with the MSCI EAFE developed markets index falling 1.5% while the MSCI EM emerging markets index advanced 1.7%.
Second quarter GDP expanded at a 3.0% annualized pace, primarily attributed to improved business investment patterns and import dynamics related to tariff policies.
The U.S. dollar index recovered from June’s close of 96.88 to finish July at 99.97, though it remains substantially lower for the year.
Bitcoin reached an all-time high of $120,198 mid-month before closing July at $116,491.
Gold prices maintained strength but remained below recent peaks, finishing the month at $3,293.
Copper prices hit record highs due to selective tariffs before experiencing a dramatic 22% single-day decline.
The Consumer Price Index increased 2.7% year-over-year in June, matching economist forecasts.
Employment growth totaled just 73,000 jobs in July. Major downward adjustments to May and June data revealed the economy performed much weaker than initially indicated. The unemployment rate held steady at 4.2%.
Equity markets achieved fresh record levels
The second quarter earnings reporting period that began in July has continued delivering upbeat results, propelling markets to new heights. Although numerous companies have cited tariff-related impacts, these effects have not been uniformly detrimental. Among S&P 500 companies that have reported, over one-third have done so, with 80% delivering earnings-per-share beats. The combined earnings growth rate now stands at 6.4% annually, below recent quarters but exceeding Wall Street projections.1
Artificial intelligence optimism bolstered multiple Magnificent 7 companies. Microsoft and Meta both delivered stronger-than-anticipated earnings while making substantial AI infrastructure investments. Consequently, Microsoft became the second company ever to achieve a market capitalization exceeding $4 trillion, joining NVIDIA. Conversely, Tesla’s disappointing second quarter results weighed on its share price.
Despite technology stocks experiencing mixed performance in 2025, the Information Technology sector has gained over 13% year-to-date, trailing only Industrials which has returned more than 15% this year. Health Care and Consumer Discretionary sectors have underperformed and posted negative returns.
Fixed income markets experienced relatively quiet conditions, with bonds declining modestly overall. The Federal Reserve maintained rates in the 4.25% to 4.50% range for the fifth consecutive meeting, balancing tariff-induced inflation concerns against economic growth considerations. Notably, two Fed governors dissented for the first time since 1993, favoring a quarter-point reduction. This follows continued public disagreement between President Trump and Fed Chair Powell as the administration pressures the Fed for lower rates.
Post-meeting employment data revealed July hiring deceleration, with 73,000 jobs created during the month. Earlier reports underwent downward revisions, indicating 258,000 fewer jobs were added in May and June than originally stated. The three-month average now totals only 35,000 monthly job additions, well below historical norms. This development suggests the Fed may need to emphasize the employment component of its dual mandate, raising the likelihood of rate reductions potentially starting in September.
Market participants monitor trade agreement progress and tariff developments
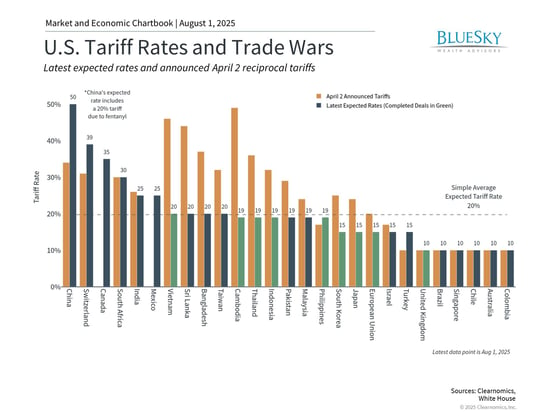
Throughout July, the administration announced multiple trade agreements with the European Union, Japan, and South Korea. Negotiations with China continue. These agreements prevented the most severe outcomes many investors anticipated in April, though numerous other nations still face potentially elevated rates as negotiation deadlines approach. On July 31, President Trump signed an executive order establishing new tariff rates for various trading partners, effective August 7 (extending the previous August 1 deadline), as illustrated in the accompanying chart.
According to Yale Budget Lab estimates as of July 23, consumers now face an overall effective tariff rate of 20.2%, the highest level since 1911. To date, companies appear to have absorbed much of these additional costs rather than transferring them to consumers. Whether this pattern continues depends on final tariff levels and corporate adaptation strategies.
Congress enacted significant tax and cryptocurrency legislation
Bitcoin achieved new peaks in July as lawmakers deliberated cryptocurrency regulation legislation. The administration’s perceived support for broader cryptocurrency adoption has contributed to Bitcoin’s 2025 gains. Additionally, the enacted GENIUS Act addresses stablecoins, which are typically linked to the U.S. dollar.
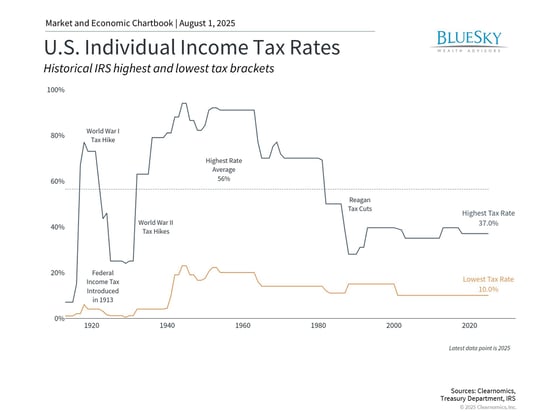
On July 4, President Trump signed comprehensive tax and spending legislation that permanently extended numerous Tax Cuts and Jobs Act provisions, including existing tax rates and brackets. The bill enhances investor certainty by preserving the current low-tax framework while raising questions about national debt sustainability.
The Congressional Budget Office projects the legislation will increase national debt by over $3 trillion during the next decade. Although the bill included spending reductions for major programs, these were exceeded by tax revenue decreases.
Making these tax changes permanent eliminates uncertainty that has impacted long-term financial planning, as many TCJA provisions were set to expire this year. This development could bolster business investment and consumer spending in the immediate term.
The bottom line? Markets established numerous records during a volatile month characterized by tariff uncertainty, new tax legislation, and earnings reports. Moving into August, trade developments and corporate earnings will likely continue capturing investor attention.
Copyright (c) 2025 Clearnomics, Inc. All rights reserved. The information contained herein has been obtained from sources believed to be reliable, but is not necessarily complete and its accuracy cannot be guaranteed. No representation or warranty, express or implied, is made as to the fairness, accuracy, completeness, or correctness of the information and opinions contained herein. The views and the other information provided are subject to change without notice. All reports posted on or via www.clearnomics.com or any affiliated websites, applications, or services are issued without regard to the specific investment objectives, financial situation, or particular needs of any specific recipient and are not to be construed as a solicitation or an offer to buy or sell any securities or related financial instruments. Past performance is not necessarily a guide to future results. Company fundamentals and earnings may be mentioned occasionally, but should not be construed as a recommendation to buy, sell, or hold the company’s stock. Predictions, forecasts, and estimates for any and all markets should not be construed as recommendations to buy, sell, or hold any security–including mutual funds, futures contracts, and exchange traded funds, or any similar instruments. The text, images, and other materials contained or displayed in this report are proprietary to Clearnomics, Inc. and constitute valuable intellectual property. All unauthorized reproduction or other use of material from Clearnomics, Inc. shall be deemed willful infringement(s) of this copyright and other proprietary and intellectual property rights, including but not limited to, rights of privacy. Clearnomics, Inc. expressly reserves all rights in connection with its intellectual property, including without limitation the right to block the transfer of its products and services and/or to track usage thereof, through electronic tracking technology, and all other lawful means, now known or hereafter devised. Clearnomics, Inc. reserves the right, without further notice, to pursue to the fullest extent allowed by the law any and all criminal and civil remedies for the violation of its rights.
Corporate earnings reports typically offer valuable insights into business performance, but this earnings season holds special significance given ongoing tariff considerations. Despite major indices hitting record highs amid improving trade relations, questions remain about tariff effects on consumers and companies. Encouraging developments include new trade agreements and corporate earnings that surpass analyst projections.
Recent data indicates robust consumer spending alongside corporate earnings growth that continues outpacing forecasts. The Yale Budget Lab reports consumers currently face an average effective tariff rate of 20.2% as of July 23, marking the highest level since 1911.1
The absence of this impact in consumer spending data suggests many companies are absorbing tariff costs rather than immediately transferring them to customers. This appears feasible due to strong earnings momentum and robust profit margins.
With more than one-third of S&P 500 companies reporting second-quarter results, 80% have exceeded earnings-per-share expectations, while the blended earnings growth rate of 6.4% has surpassed the anticipated 4.9%, per FactSet data.2
Although this growth rate trails recent quarters, it indicates an “earnings recession” – characterized by sharp profit declines like those in 2020 or 2022 – appears less probable than initially anticipated.
Corporate earnings are beating expectations so far
Understanding tariff payments and their potential appearance in financial data requires examining who bears the costs. While governments collect tariffs as revenue, the actual burden falls on either U.S. exporters or American consumers and businesses through elevated prices. The distribution between these groups depends on their respective “pricing power.”
Consider rare earth metals essential for electronic devices – nearly all imported to the U.S. Given limited alternative sources, tariffs would likely transfer directly to consumers. This explains the administration’s pursuit of expanded rare earth metal import agreements with China and increased focus on domestic production capabilities.
Conversely, the automotive sector features intense competition among domestic manufacturers and numerous countries seeking U.S. export opportunities. When tariffs target vehicles from specific countries, those manufacturers might absorb portions of the costs to maintain competitiveness against other nations’ products and domestic alternatives.
Therefore, short-term tariff effects depend on industry competitiveness and available consumer and business alternatives. Over longer periods, supply chains can adapt to new circumstances while currency values adjust accordingly.
Consequently, tariff impacts on earnings and corporate responses vary significantly across industries. General Motors reported $1.1 billion in tariff-related profit losses during the second quarter, with margins declining from 9% to 6.1%.3
Conversely, Cleveland-Cliffs, a domestic flat-rolled steel producer, announced second-quarter earnings exceeding expectations, benefiting from tariffs that reduced steel imports.4
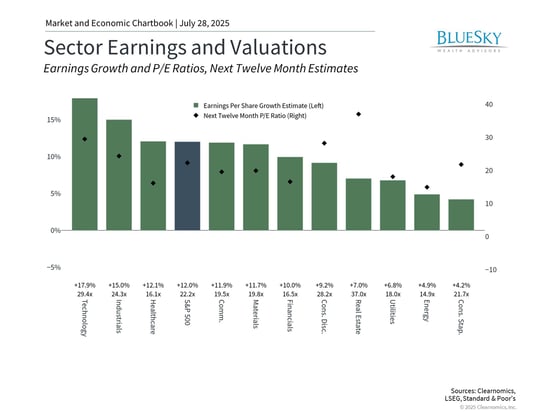
The accompanying chart demonstrates how earnings expectations differ substantially across sectors, partially reflecting trade impacts. Understanding tariffs’ complete effects on companies may require several quarters, particularly as new trade agreements emerge.
Multiple countries have established new arrangements, some featuring considerably lower tariffs than those initially declared April 2. Recent announcements indicate the European Union and Japan will face 15% tariffs on U.S. exports, while Indonesia and the Philippines encounter 19% rates. Meanwhile, China discussions continue following earlier trade truce developments.
Markets continue to reach new all-time highs
Financial markets have sustained their climb to record levels as earnings surprises and new trade agreements emerge. The chart demonstrates the S&P 500 achieving over twelve new peaks this year, with most occurring within the past month. The Nasdaq has similarly reached historic levels, surpassing its previous December record, while the Dow approaches new territory. Though current levels may concern some investors, major indices typically establish numerous records annually during expansion periods.
Strong market performance continues despite persistent concerns about tariff economic impacts. Various economic projections, including Federal Reserve forecasts, suggest slightly elevated inflation and modestly reduced growth. Industry impacts will vary based on input costs, with import-dependent sectors facing compressed margins. However, these projections must balance against domestic investment benefits and companies’ adaptive capabilities through innovation and efficiency improvements.
While tariffs remain historically elevated, their predictability matters more, as stable business environments enable more effective operational and supply chain adaptations. Looking ahead, Wall Street consensus projects S&P 500 earnings growing at 9.5% annually. These forecasts anticipate accelerating growth over the next two years as global trade stabilizes, though conditions could change significantly.
Earnings are an important long-term driver of returns
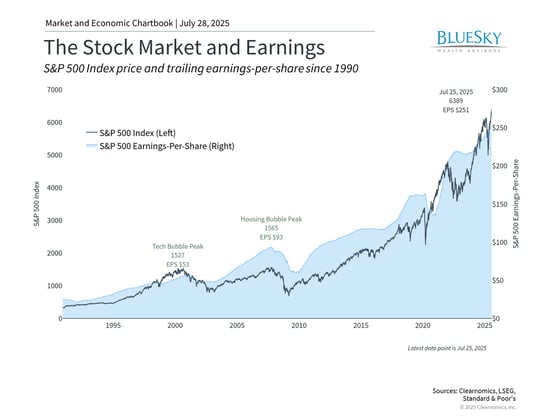
Stock markets generally track corporate earnings over extended periods. The chart reveals that while S&P 500 prices and earnings don’t align perfectly, they follow similar broad trajectories. This occurs because economic expansion drives earnings growth, which subsequently elevates stock prices. Although the economy and stock market aren’t identical, they connect closely through corporate performance.
This relationship explains how tariff profit impacts can affect investors. Market valuations as “cheap” or “expensive” depend on both stock prices and corporate performance. The price-to-earnings ratio simply divides stock or index prices by earnings measures, such as projected twelve-month earnings.
This means rising earnings make markets more attractive even without price changes, and vice versa. The current S&P 500 price-to-earnings ratio stands at 22.2x, significantly above the historical 15.8x average and approaching the dot-com bubble peak of 24.5x. While current earnings trends appear positive, continued market attractiveness will depend on economic growth and earnings performance.
The bottom line? This earnings season may illuminate tariff effects on consumers and businesses. For investors, understanding these developments while maintaining long-term planning focus remains the optimal approach to achieving financial objectives.
Copyright (c) 2025 Clearnomics, Inc. All rights reserved. The information contained herein has been obtained from sources believed to be reliable, but is not necessarily complete and its accuracy cannot be guaranteed. No representation or warranty, express or implied, is made as to the fairness, accuracy, completeness, or correctness of the information and opinions contained herein. The views and the other information provided are subject to change without notice. All reports posted on or via www.clearnomics.com or any affiliated websites, applications, or services are issued without regard to the specific investment objectives, financial situation, or particular needs of any specific recipient and are not to be construed as a solicitation or an offer to buy or sell any securities or related financial instruments. Past performance is not necessarily a guide to future results. Company fundamentals and earnings may be mentioned occasionally, but should not be construed as a recommendation to buy, sell, or hold the company’s stock. Predictions, forecasts, and estimates for any and all markets should not be construed as recommendations to buy, sell, or hold any security–including mutual funds, futures contracts, and exchange traded funds, or any similar instruments. The text, images, and other materials contained or displayed in this report are proprietary to Clearnomics, Inc. and constitute valuable intellectual property. All unauthorized reproduction or other use of material from Clearnomics, Inc. shall be deemed willful infringement(s) of this copyright and other proprietary and intellectual property rights, including but not limited to, rights of privacy. Clearnomics, Inc. expressly reserves all rights in connection with its intellectual property, including without limitation the right to block the transfer of its products and services and/or to track usage thereof, through electronic tracking technology, and all other lawful means, now known or hereafter devised. Clearnomics, Inc. reserves the right, without further notice, to pursue to the fullest extent allowed by the law any and all criminal and civil remedies for the violation of its rights.
The relationship between the White House and the Federal Reserve has recently sparked renewed debate about central bank independence. This tension stems from the inherently different objectives and timeframes that guide elected officials versus Fed policymakers.
Political leaders typically favor accommodative monetary policy to stimulate economic activity and reduce government borrowing costs. Meanwhile, the Federal Reserve must balance multiple considerations, including price stability and financial system health, often requiring decisions that extend beyond electoral cycles.
While the Fed has faced criticism throughout its history, with numerous publications documenting both triumphs and missteps of various chairs, central bank independence has remained a cornerstone of the financial system for generations. Current discussions often focus on legal questions about presidential authority over Fed leadership, procedural implications of potential changes, and speculation about future appointments.
For investors, the critical consideration is whether monetary policy continues to serve economic stability effectively. Regardless of any administrative actions, Jerome Powell’s chairmanship is scheduled to conclude by May 2026. What factors should investors monitor regarding Fed policy in the years ahead?
Central bank autonomy has transformed over decades
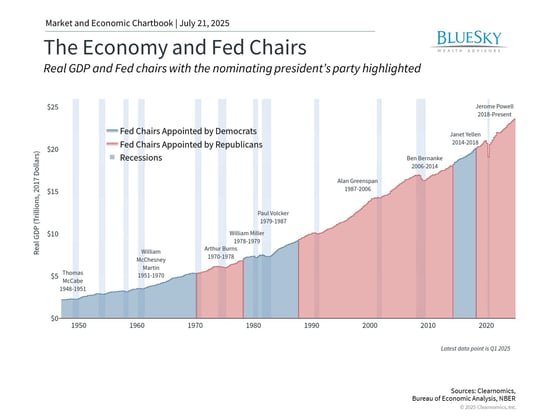
The chart illustrates the nine Federal Reserve chairs who have served since 1948. Most have worked under administrations from both political parties, with several receiving reappointments from presidents of different affiliations. Jerome Powell exemplifies this pattern, having been initially selected by President Trump in 2017 and later reconfirmed under President Biden. The data also demonstrates consistent economic expansion under Fed leadership regardless of the appointing party.
Central bank independence is frequently assumed rather than examined, making its historical development worth understanding. As the nation’s monetary authority, the Fed establishes interest rate policy and supervises financial system stability. Independence enables the Fed to base decisions solely on economic fundamentals rather than political considerations.
This autonomy has emerged gradually over time. The Federal Reserve was created through congressional legislation in 1913, not constitutional mandate. The Fed’s dual mandate has similarly evolved and is commonly understood as maintaining full employment while targeting 2% inflation. Contemporary monetary policy reflects lessons learned from historical economic crises and inflationary episodes.
After the Great Depression, the Banking Act of 1935 reorganized the Fed by concentrating authority within the Board of Governors and removing the Treasury Secretary to limit political interference. During World War II, the Fed temporarily sacrificed independence by keeping rates low to support wartime financing. The 1951 Treasury-Fed Accord is widely credited with restoring independence by ending the Fed’s obligation to maintain government bond prices.
Current inflation and policy dynamics present ongoing challenges
Today’s circumstances bear resemblance to the 1970s and early 1980s period. Before the 1972 election, President Nixon pressured for expansionary monetary policy to support his reelection prospects. Fed Chair Arthur Burns, previously Nixon’s economic adviser, accommodated these preferences by easing policy, which economists believe intensified the subsequent decade’s inflation.1
Paul Volcker’s leadership in the early 1980s eventually restored price stability through recession-inducing rate increases. Though most economists credit this approach with ending the era’s “stagflation,” it generated significant political friction. Volcker’s memoirs describe pressure from the Reagan administration to avoid rate hikes before elections.2
Current economic conditions mirror aspects of the 1970s, with policymakers balancing the need for restrictive policy to secure inflation progress against pressures to stimulate growth. While inflation has moved closer to the Fed’s 2% objective, headline CPI remains at 2.7% with core inflation at 2.9% in the most recent data. The Fed is also monitoring potential price effects from proposed tariff policies.
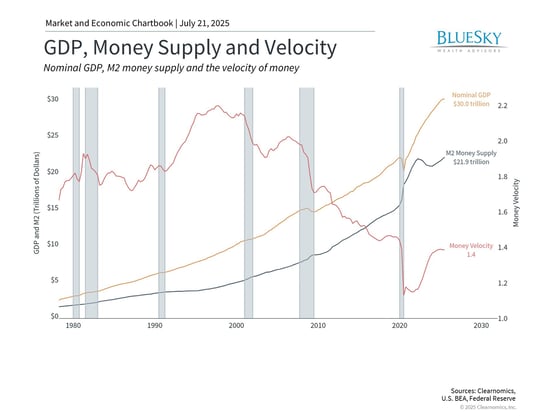
The money supply data shown above helps illustrate this complexity. Fed-managed money supply typically grows steadily to support stable expansion and inflation. During crises like 2020, money supply serves as an economic support mechanism. Recent years have seen flat money supply growth as officials prioritized inflation control, potentially conflicting with some political preferences.
Further rate reductions remain anticipated
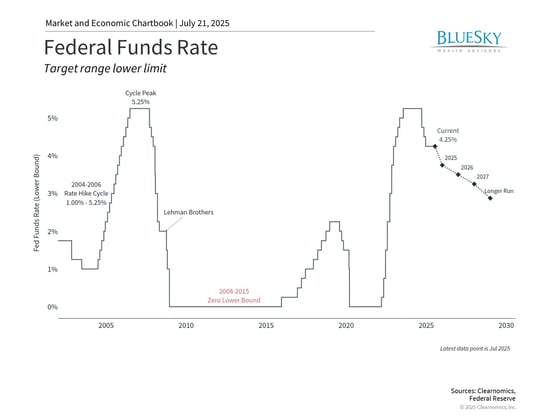
Setting politics aside, markets expect additional Fed rate cuts this year. Policy has remained unchanged following several reductions in late 2024 amid tariff-related uncertainty. Fed policy fundamentally serves long-term growth objectives. During economic expansion, the Fed prevents overheating – sometimes called “removing the punch bowl.” During weakness, lower rates may be necessary to stimulate activity.
This calibration proves difficult under optimal conditions. Retrospectively, the Fed often faces criticism for being “behind the curve.” Alan Greenspan, who chaired the Fed for nearly two decades, failed to address the housing bubble developing late in his tenure. More recently, critics argue the Fed responded too gradually to clear inflation signals in 2022.
Rather than debating past Fed decisions, investors should focus on responding appropriately to current conditions with long-term strategies. Historical evidence shows that Fed leadership transitions and policy shifts create uncertainty, yet markets have generally performed well despite these challenges.
The bottom line? Markets and the economy have thrived under various monetary policy regimes and political environments. Maintaining a long-term investment approach that can weather this uncertainty remains the optimal path to achieving financial objectives.
Volcker, P. A. (2018). Keeping At It: The Quest for Sound Money and Good Government
BlueSky Disclosures
Copyright (c) 2025 Clearnomics, Inc. All rights reserved. The information contained herein has been obtained from sources believed to be reliable, but is not necessarily complete and its accuracy cannot be guaranteed. No representation or warranty, express or implied, is made as to the fairness, accuracy, completeness, or correctness of the information and opinions contained herein. The views and the other information provided are subject to change without notice. All reports posted on or via www.clearnomics.com or any affiliated websites, applications, or services are issued without regard to the specific investment objectives, financial situation, or particular needs of any specific recipient and are not to be construed as a solicitation or an offer to buy or sell any securities or related financial instruments. Past performance is not necessarily a guide to future results. Company fundamentals and earnings may be mentioned occasionally, but should not be construed as a recommendation to buy, sell, or hold the company’s stock. Predictions, forecasts, and estimates for any and all markets should not be construed as recommendations to buy, sell, or hold any security–including mutual funds, futures contracts, and exchange traded funds, or any similar instruments. The text, images, and other materials contained or displayed in this report are proprietary to Clearnomics, Inc. and constitute valuable intellectual property. All unauthorized reproduction or other use of material from Clearnomics, Inc. shall be deemed willful infringement(s) of this copyright and other proprietary and intellectual property rights, including but not limited to, rights of privacy. Clearnomics, Inc. expressly reserves all rights in connection with its intellectual property, including without limitation the right to block the transfer of its products and services and/or to track usage thereof, through electronic tracking technology, and all other lawful means, now known or hereafter devised. Clearnomics, Inc. reserves the right, without further notice, to pursue to the fullest extent allowed by the law any and all criminal and civil remedies for the violation of its rights.
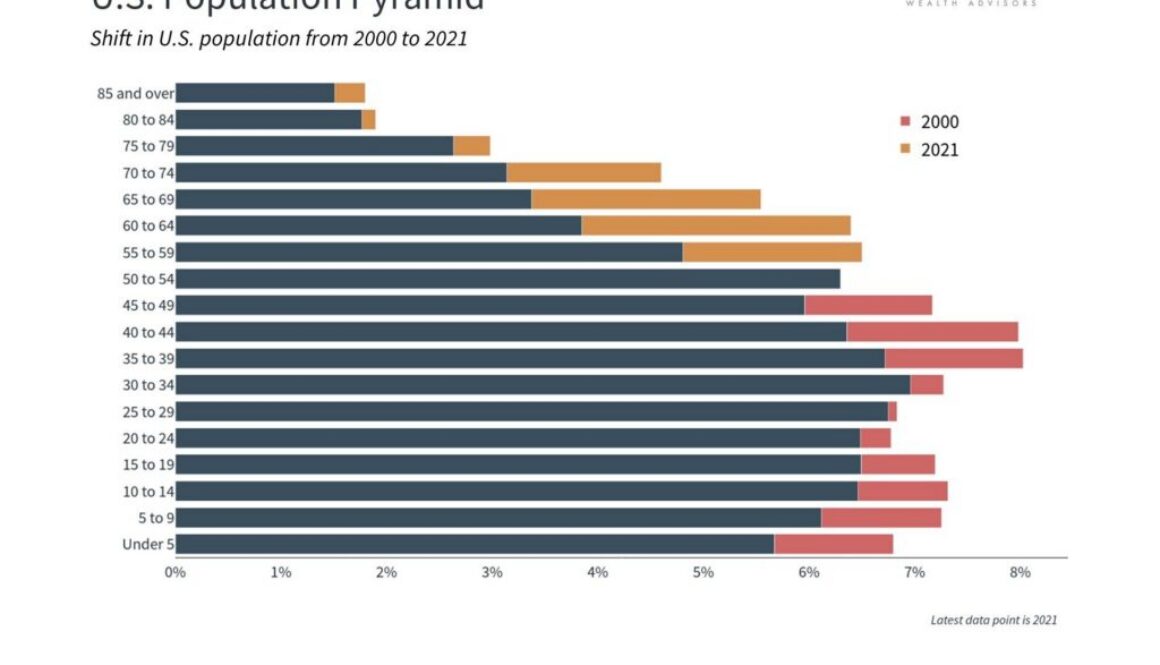
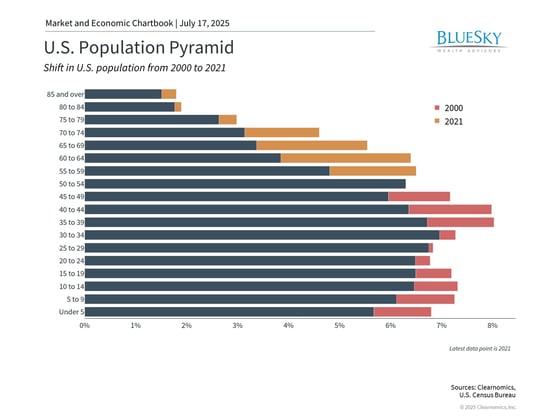
For nearly nine decades, Social Security has served as a cornerstone retirement program, supporting millions of Americans as they transition from their working years. However, demographic shifts and an aging population have raised questions about the program’s long-term sustainability. While Social Security remains a vital component of retirement income, today’s financial landscape demands a comprehensive approach to retirement planning that extends well beyond government benefits.
Regardless of whether retirement is approaching soon or remains years away, gaining insight into Social Security’s role within your broader financial strategy is essential. Understanding the program’s background, current obstacles, and available planning approaches will help you make informed decisions about your financial future.
Social Security’s historical foundation
Created in 1935 under President Franklin D. Roosevelt’s administration during the Great Depression, Social Security originated as a protective measure for America’s elderly population. From its humble beginnings providing basic benefits to a limited group, the program has grown into an extensive system supporting retirees, disabled individuals, and their dependents. Currently, Social Security benefits constitute a substantial portion of retirement income for countless Americans.
What obstacles does Social Security face in today’s environment? The program functions mainly through a pay-as-you-go structure, meaning current workers’ payroll contributions fund today’s benefit recipients. Put simply, the contributions you make don’t accumulate for your future benefits but instead support current retirees’ monthly payments.
This approach functioned effectively when worker-to-beneficiary ratios remained favorable throughout most of the 20th century. Nevertheless, changing demographics have resulted in fewer active workers supporting the system while more individuals claim retirement benefits. The statistics tell the story: in 1940, 42 workers supported each retiree, but today that figure has dropped to approximately 2.8 workers per beneficiary, with projections showing continued decline as aging accelerates and birth rates remain low.
Various forecasts have attempted to predict when Social Security trust funds might face depletion. According to the most recent Social Security Board of Trustees report, reserves should last until 2034, at which point benefit reductions would become necessary. Even then, continuing payroll contributions would still finance roughly 78% of promised benefits. Though specific timelines may vary, the core issue persists: absent significant reforms, the trust funds may struggle to maintain full benefit payments over the long term.
Increased longevity benefits individuals but strains Social Security funding
The nation’s debt burden, approaching $37 trillion alongside ongoing budget deficits, compounds concerns about program sustainability. Despite Social Security’s “mandatory” classification, mounting pressure to reduce government expenditures creates uncertainty regarding potential congressional modifications to these programs.
Given the intense political debate surrounding potential solutions, achieving a near-term Social Security fix appears unlikely. Proposed remedies include adjusting retirement age requirements, expanding the taxable wage ceiling, and enhancing fraud prevention measures. Regrettably, few comprehensive long-term approaches exist to permanently resolve Social Security’s challenges.
Examining other developed countries facing similar demographic pressures offers valuable insights. Several European nations, including France and the UK, have raised retirement ages to alleviate system strain. Australia has implemented a different strategy through “means-testing,” which limits benefits to retirees meeting specific asset and income criteria.
Although the 2034 depletion timeline remains several years ahead, the urgency for solutions will continue mounting. While complete benefit elimination seems highly improbable, Social Security’s ongoing funding difficulties will likely necessitate program adjustments.
Retirement Planning Considerations and Strategies
Focusing on individual actions, thoughtful planning becomes essential for maintaining retirement progress amid Social Security uncertainty. Optimal decisions depend on your comprehensive financial situation, objectives, tax circumstances, and additional factors.
Consider these key elements:
Benefits Timing Decisions Retirement benefits become available at age 62, though early claiming reduces monthly payments. Alternatively, postponing benefits until age 70 can boost monthly payments by roughly 8% annually beyond full retirement age (66-67, based on birth year), per Social Security Administration guidelines. Breakeven calculations help evaluate whether delaying proves beneficial. Typically, individuals living past their early 80s receive higher lifetime payments by delaying benefits. However, this assessment shifts when considering time value of money or opportunity costs.
Income Bridge Approaches The benefit of delaying largely depends on income sources during the waiting period. Some retirees utilize portfolio distributions as a “bridge” toward enhanced Social Security payments later. This approach proves especially valuable for married couples, where maximizing the higher earner’s benefit establishes a larger survivor benefit.
Tax Planning Considerations As much as 85% of Social Security benefits may face taxation, based on combined income levels. Future tax legislation could potentially raise this percentage. Strategic distribution planning with professional guidance can help reduce the tax burden on your benefits.
Cautious Planning Assumptions Individuals earlier in their careers possess more time for retirement preparation and greater flexibility to accommodate Social Security uncertainty. Therefore, younger professionals might consider developing retirement plans that minimize Social Security dependence. This approach doesn’t mean completely disregarding it, but rather viewing potential benefits as supplementary to personal savings instead of foundational support.
Policy Development Monitoring Legislative changes will probably emerge before trust fund depletion occurs. Remaining current on proposed reforms enables you to modify your planning strategy appropriately. Potential modifications include additional full retirement age increases, benefit formula adjustments, or payroll tax cap changes.
Tax-Advantaged Account Optimization Given Social Security’s uncertain outlook, maximizing 401(k), IRA, and HSA contributions gains heightened importance. These vehicles offer tax benefits that can help offset potentially diminished government benefits.
Social Security’s Future Demands Thoughtful Preparation
While legitimate concerns exist, maintaining proper perspective remains crucial. Social Security has navigated funding challenges previously, and political motivation to preserve the program continues strongly.
The sensible approach involves neither complete reliance on nor total dismissal of Social Security’s retirement planning role. Instead, investors should acknowledge the program’s significance while viewing it as just one element of a well-rounded retirement approach.
The bottom line? Comprehending Social Security’s challenges enables you to construct a more robust retirement plan, regardless of your current age or professional phase.
BlueSky Disclosures
Copyright (c) 2025 Clearnomics, Inc. All rights reserved. The information contained herein has been obtained from sources believed to be reliable, but is not necessarily complete and its accuracy cannot be guaranteed. No representation or warranty, express or implied, is made as to the fairness, accuracy, completeness, or correctness of the information and opinions contained herein. The views and the other information provided are subject to change without notice. All reports posted on or via www.clearnomics.com or any affiliated websites, applications, or services are issued without regard to the specific investment objectives, financial situation, or particular needs of any specific recipient and are not to be construed as a solicitation or an offer to buy or sell any securities or related financial instruments. Past performance is not necessarily a guide to future results. Company fundamentals and earnings may be mentioned occasionally, but should not be construed as a recommendation to buy, sell, or hold the company’s stock. Predictions, forecasts, and estimates for any and all markets should not be construed as recommendations to buy, sell, or hold any security–including mutual funds, futures contracts, and exchange traded funds, or any similar instruments. The text, images, and other materials contained or displayed in this report are proprietary to Clearnomics, Inc. and constitute valuable intellectual property. All unauthorized reproduction or other use of material from Clearnomics, Inc. shall be deemed willful infringement(s) of this copyright and other proprietary and intellectual property rights, including but not limited to, rights of privacy. Clearnomics, Inc. expressly reserves all rights in connection with its intellectual property, including without limitation the right to block the transfer of its products and services and/or to track usage thereof, through electronic tracking technology, and all other lawful means, now known or hereafter devised. Clearnomics, Inc. reserves the right, without further notice, to pursue to the fullest extent allowed by the law any and all criminal and civil remedies for the violation of its rights.
Investors often struggle to maintain focus on long-term objectives while navigating short-term market volatility. This challenge persists whether markets are climbing or declining. Recent attention on cryptocurrencies, commodities, and alternative investments can create urgency to react to daily news cycles, potentially triggering concerns about missing opportunities.
Seasoned investors who have weathered multiple market cycles understand that sustainable returns require disciplined approaches. Traditional assets like stocks and bonds continue to serve as portfolio cornerstones because they offer the risk-return balance necessary for achieving financial objectives. Meanwhile, market enthusiasm for specific assets, whether technology stocks or digital currencies, can shift rapidly and unexpectedly.
Successful investing centers on building portfolios that harness diverse asset characteristics while staying aligned with long-term financial plans. What matters most isn’t holding the trending investment of the moment, but ensuring your portfolio supports retirement security, family provisions, homeownership goals, or philanthropic aspirations.
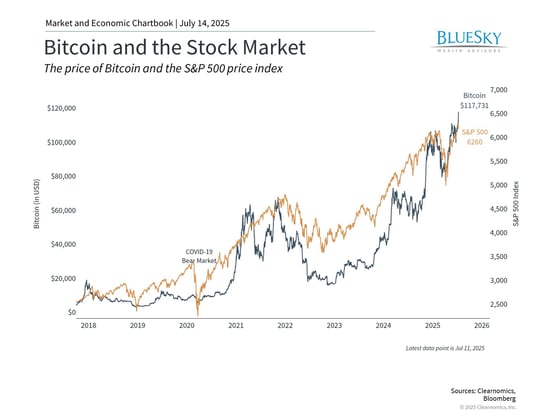
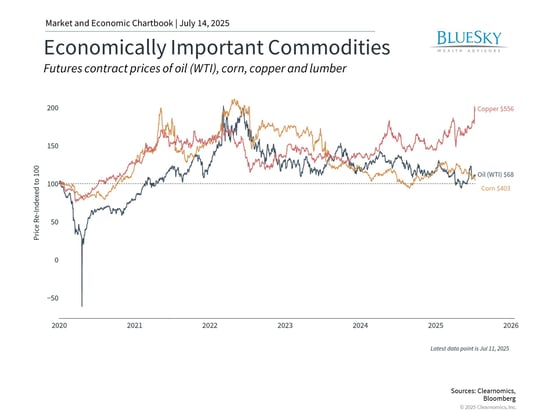
Recent surges in Bitcoin to record heights, copper hitting new peaks, and rising precious metals present investors with complex allocation decisions. These rallies stem from both broad market improvements and specific policy shifts in Washington, alongside growing institutional participation. How can investors evaluate these assets through a portfolio lens rather than as isolated opportunities?
Bitcoin has reached unprecedented levels amid Congressional consideration of cryptocurrency legislation during “Crypto Week.” The House is examining the GENIUS Act for stablecoin regulation, digital currencies typically pegged to the U.S. dollar. Additional proposals include the CLARITY Act for clearer cryptocurrency frameworks and the Anti-CBDC Surveillance State Act, which would prevent Federal Reserve digital currency creation.
Cryptocurrencies like Bitcoin draw attention through dramatic price movements, expanding institutional adoption, new investment vehicles including ETFs, and monetary policy concerns. These factors involve considerable complexity and speculation. For long-term investors, the crucial question becomes whether digital currencies serve meaningful portfolio functions.
Bitcoin’s portfolio suitability depends on individual objectives and risk capacity. Bitcoin exhibits price swings multiple times larger than equity markets. The 2022 bear market saw Bitcoin decline over 75% while the S&P 500 fell approximately 25%, illustrating how digital assets can magnify portfolio risk during market downturns. While Bitcoin recovered more dramatically, the chart demonstrates similar performance patterns to the S&P 500 since 2018, despite different trajectories.
Not all cryptocurrencies mirror Bitcoin’s performance. Ethereum, another prominent digital currency, shows negative returns this year and has dropped roughly 25% from December highs. Numerous other cryptocurrencies and “meme coins” have followed distinct paths. Careful portfolio-context evaluation remains essential rather than headline-driven reactions.
Copper’s surge reflects economic growth and trade policy
Copper has captured media attention by reaching record levels following White House announcements of 50% import tariffs.
As an industrial metal crucial for construction, electrical systems, electronics, and renewable energy infrastructure, copper plays a vital economic role. Market participants often view copper as “Dr. Copper,” an economic indicator whose price movements can signal broader economic trends.
The United States imports 45% of its copper consumption, mainly from Chile, Canada, Mexico, and Peru. While tariff policies may encourage domestic production over time, they create immediate pricing and supply chain impacts. China’s significant copper demand also makes the metal sensitive to global economic conditions and trade dynamics.
For investors, distinguishing between sharp price changes and portfolio fit remains crucial, similar to Bitcoin and other volatile assets. Attempting to forecast copper’s direction resembles predicting precise economic and trade policy outcomes. Instead, investors should evaluate whether copper and similar assets enhance portfolio characteristics alongside other economically-sensitive holdings like equities.
Gold and silver present unique investment considerations
Gold and silver have gained recently, benefiting from traditional roles as potential hedges against currency movements, inflation pressures, geopolitical risks, and central bank accumulation. Theoretically, these precious metals can preserve value during economic uncertainty, though they face limitations including lack of income generation.
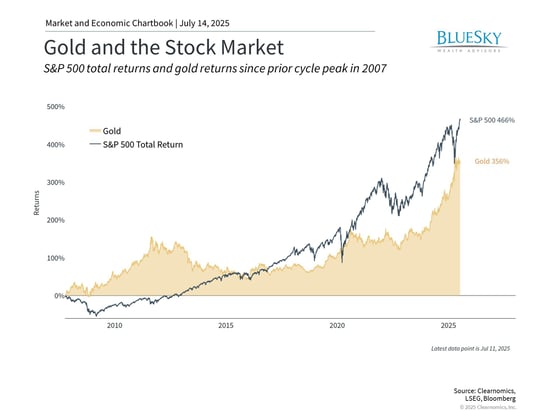
The chart illustrates gold’s value increases during events like the global financial crisis. However, over extended periods, equity markets have surpassed gold performance, even after recent gains. Throughout the 2010s, many anticipated continued gold appreciation as the Fed maintained low rates. This expectation’s failure highlights the difficulty and counterintuitive nature of predicting gold’s direction.
For long-term investors, overall portfolio alignment with financial objectives should take precedence. Assets including Bitcoin, copper, gold, and silver highlight both potential advantages and the importance of thoughtful allocation choices. These assets should enhance, not substitute for, diversified positions in stocks, bonds, and other fundamental asset classes.
The bottom line? While various assets gain attention through recent performance, investors should resist chasing short-term gains. Understanding each asset’s distinct characteristics provides the foundation for aligning portfolios with long-term financial objectives.
BlueSky Disclosures
Copyright (c) 2025 Clearnomics, Inc. All rights reserved. The information contained herein has been obtained from sources believed to be reliable, but is not necessarily complete and its accuracy cannot be guaranteed. No representation or warranty, express or implied, is made as to the fairness, accuracy, completeness, or correctness of the information and opinions contained herein. The views and the other information provided are subject to change without notice. All reports posted on or via www.clearnomics.com or any affiliated websites, applications, or services are issued without regard to the specific investment objectives, financial situation, or particular needs of any specific recipient and are not to be construed as a solicitation or an offer to buy or sell any securities or related financial instruments. Past performance is not necessarily a guide to future results. Company fundamentals and earnings may be mentioned occasionally, but should not be construed as a recommendation to buy, sell, or hold the company’s stock. Predictions, forecasts, and estimates for any and all markets should not be construed as recommendations to buy, sell, or hold any security–including mutual funds, futures contracts, and exchange traded funds, or any similar instruments. The text, images, and other materials contained or displayed in this report are proprietary to Clearnomics, Inc. and constitute valuable intellectual property. All unauthorized reproduction or other use of material from Clearnomics, Inc. shall be deemed willful infringement(s) of this copyright and other proprietary and intellectual property rights, including but not limited to, rights of privacy. Clearnomics, Inc. expressly reserves all rights in connection with its intellectual property, including without limitation the right to block the transfer of its products and services and/or to track usage thereof, through electronic tracking technology, and all other lawful means, now known or hereafter devised. Clearnomics, Inc. reserves the right, without further notice, to pursue to the fullest extent allowed by the law any and all criminal and civil remedies for the violation of its rights.