The recent pullback in technology stocks has sparked discussions about market stability and investment strategies. While AI-focused companies have been key drivers of market gains in recent years, their recent weakness has highlighted questions about market concentration and valuation levels. How should investors navigate this evolving landscape while maintaining their long-term investment perspective?
Market gains are becoming more widespread

Understanding the relationship between tech stocks and the broader market is crucial for investors. While these companies have demonstrated impressive growth trajectories, their elevated valuations present both opportunities and risks. Market history demonstrates that sector leadership often rotates as market conditions and investor sentiment shift, suggesting the importance of maintaining diversified exposure across market segments.
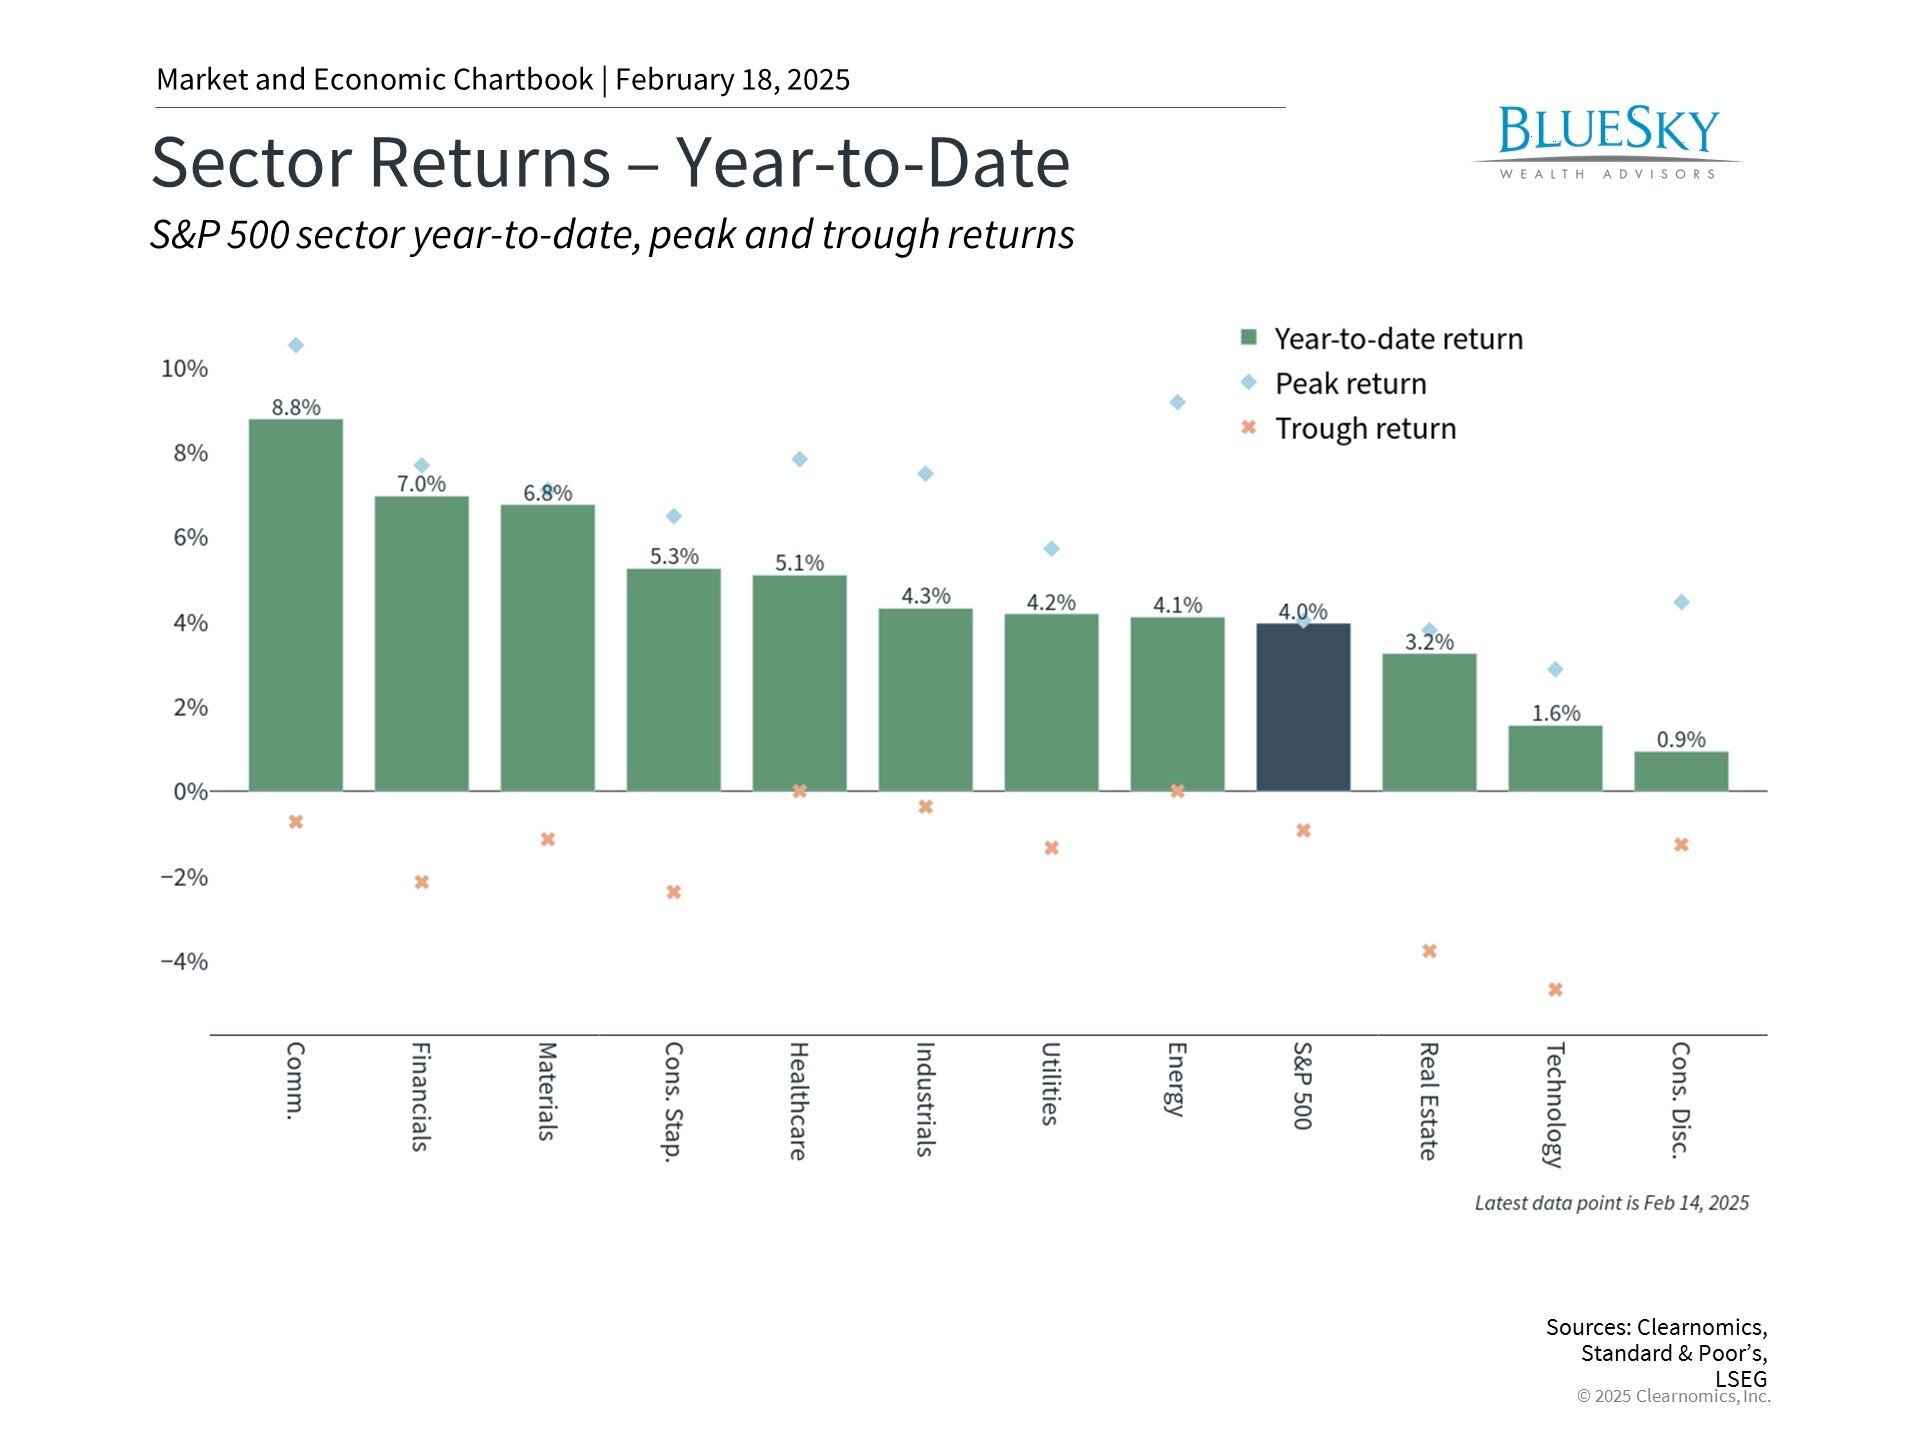
The start of 2025 has witnessed Information Technology and Consumer Discretionary sectors underperforming the broader market. This marks a shift from the period since late 2022, when these tech-heavy sectors, along with Communication Services, led market gains. The market has seen positive contributions from various sectors, including Financials, Materials, and Consumer Staples.
Several factors have contributed to this rotation, including valuation concerns, persistent interest rates, and questions surrounding tech companies' AI investments. The S&P 500's price-to-earnings ratio has reached 22x, nearing dot-com era peaks, while the Information Technology sector trades at 27.7x earnings. Meanwhile, although AI infrastructure spending continues to surge, global competition has intensified.
The broader market participation represents an encouraging development for investors seeking more balanced market performance. This early-year trend suggests a more sustainable market environment where gains are distributed across multiple sectors. It also reflects investors' search for value opportunities following substantial returns over the past two and a half years.
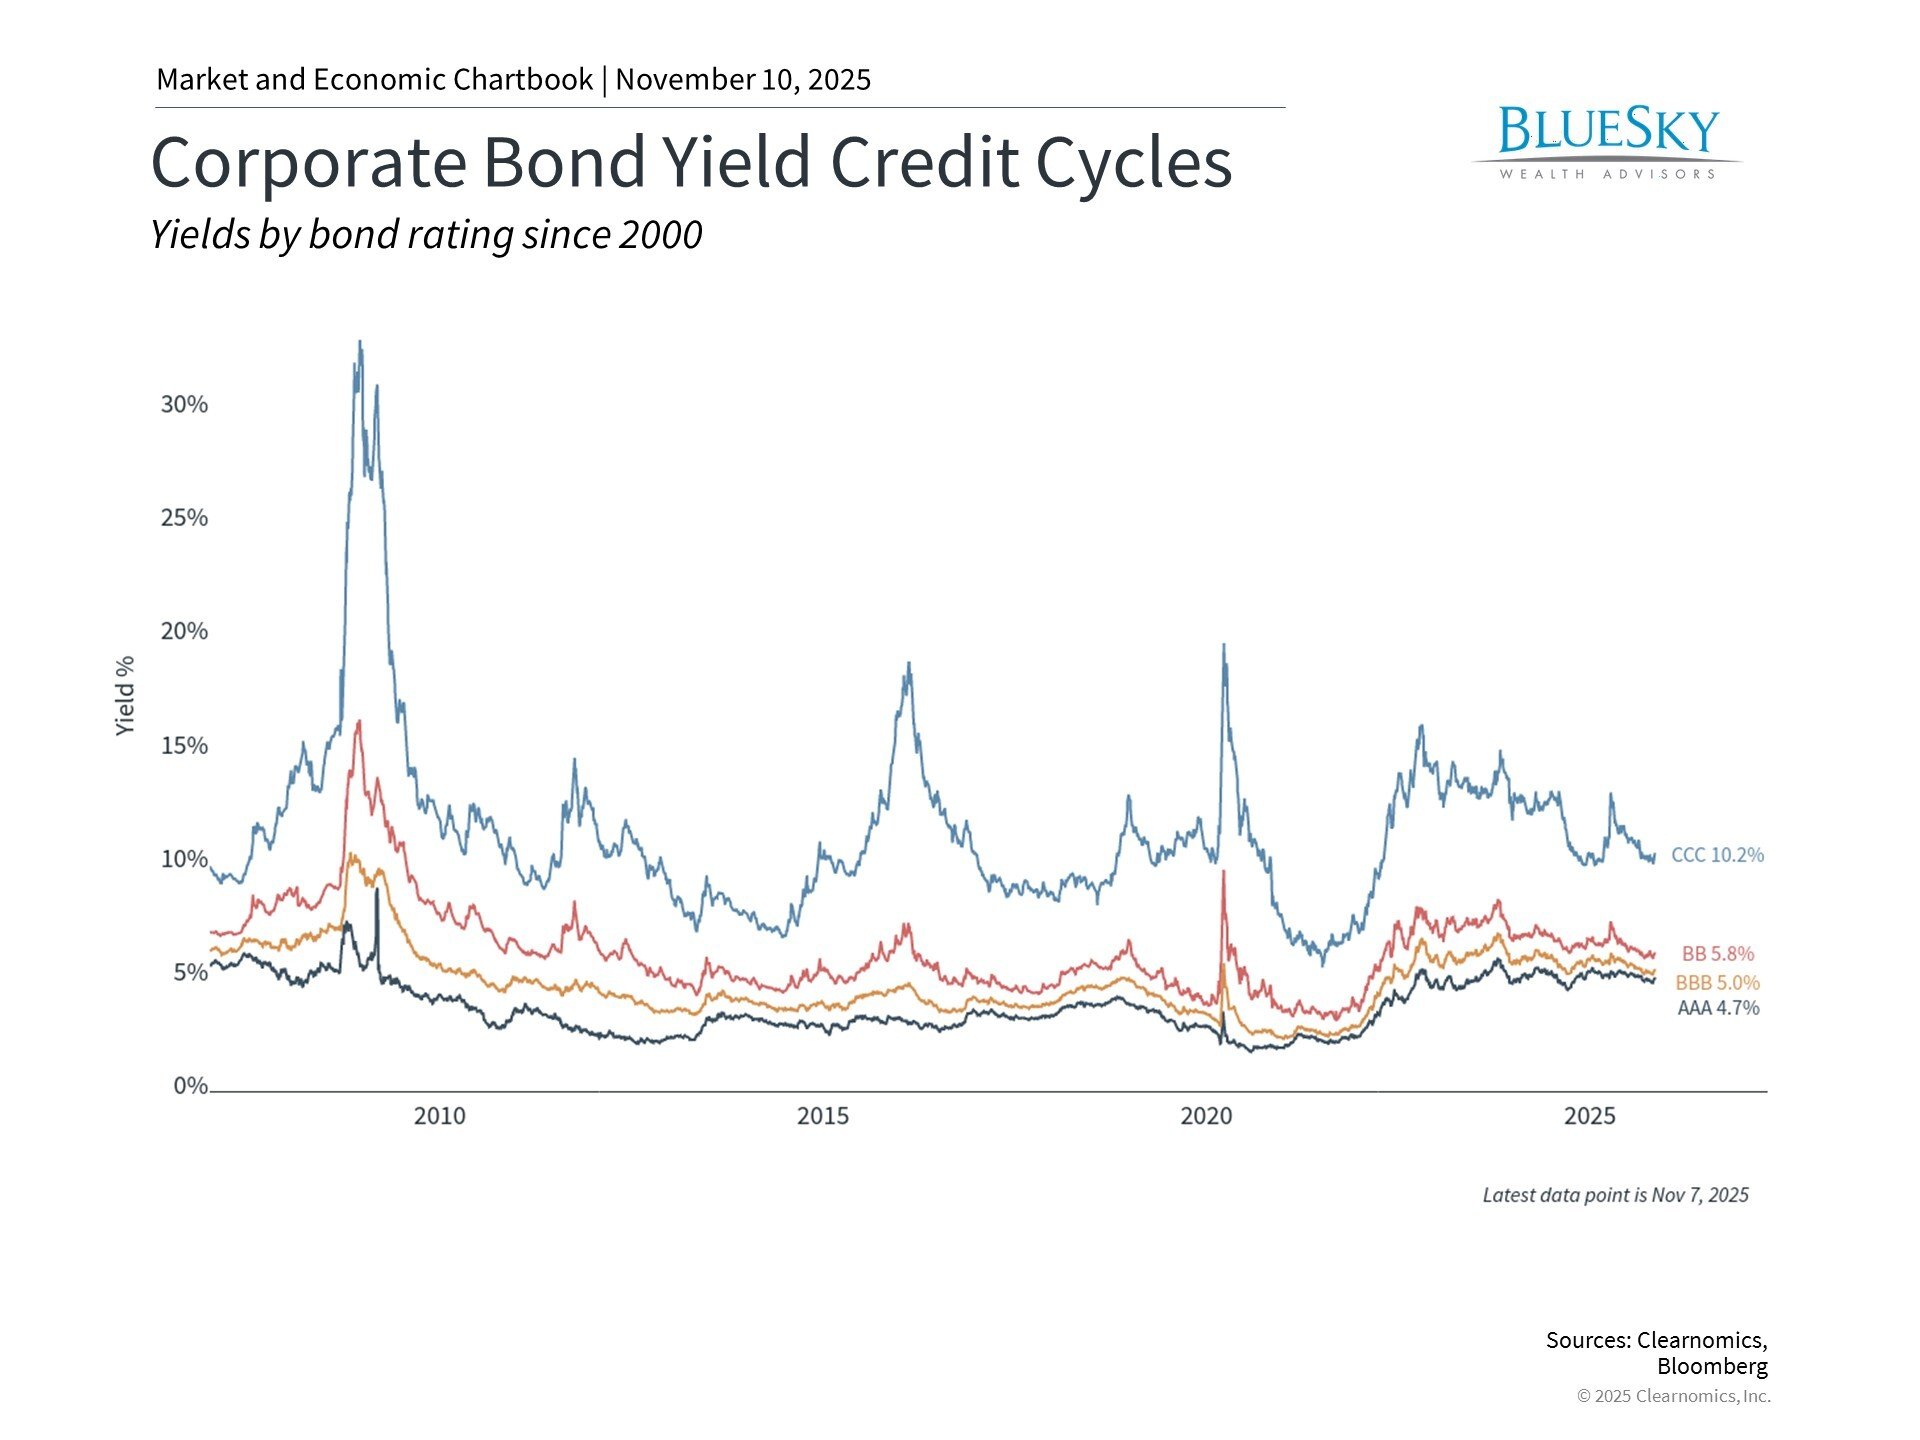
Technology investments, while potentially rewarding, are characterized by inherent volatility and economic sensitivity. The sector experienced significant drawdowns in 2022, with both the Nasdaq and S&P 500 Information Technology sector declining approximately 35% before recovering.
This pattern has historical precedent, most notably in the dot-com crash of 2000. Similar episodes occurred in earlier periods, such as the 1960s technology boom involving popular technology and electronics stocks. These companies saw substantial valuation expansion before experiencing significant declines during the 1970s market downturn.
Over longer horizons, technological advances - from semiconductors to information technology to large language models - benefit companies across sectors. The ongoing digital transformation that began in the 1990s continues to evolve. Long-term investors should maintain balanced exposure to capitalize on these broad trends rather than attempting to time sector rotations.
Market concentration remains an important consideration

Market sector composition significantly influences overall market behavior. The S&P 500's composition has evolved considerably over the past decade, with technology-related companies, particularly the Magnificent 7 (Apple, Nvidia, Microsoft, Amazon, Alphabet, Meta, and Tesla), now dominating the index's largest positions.
The market's reliance on a small group of stocks raises sustainability concerns among investors. This concentration risk represents potential vulnerability from excessive exposure to particular sectors, asset classes, or investment groups. Many portfolios may have unintentionally increased their sector exposure as dominant index constituents have grown larger.
This dynamic is clearly illustrated by comparing the market-cap weighted S&P 500 index with its equal-weighted counterpart. The former reflects actual market composition, while equal weighting provides exposure to a broader range of companies regardless of size.
While concentration can amplify both positive and negative returns, diversification helps manage downside risk. Regular portfolio monitoring and rebalancing may be necessary to maintain desired risk levels. Consulting with a trusted advisor who understands your financial objectives is valuable in this environment.
Different sectors drive returns across market cycles

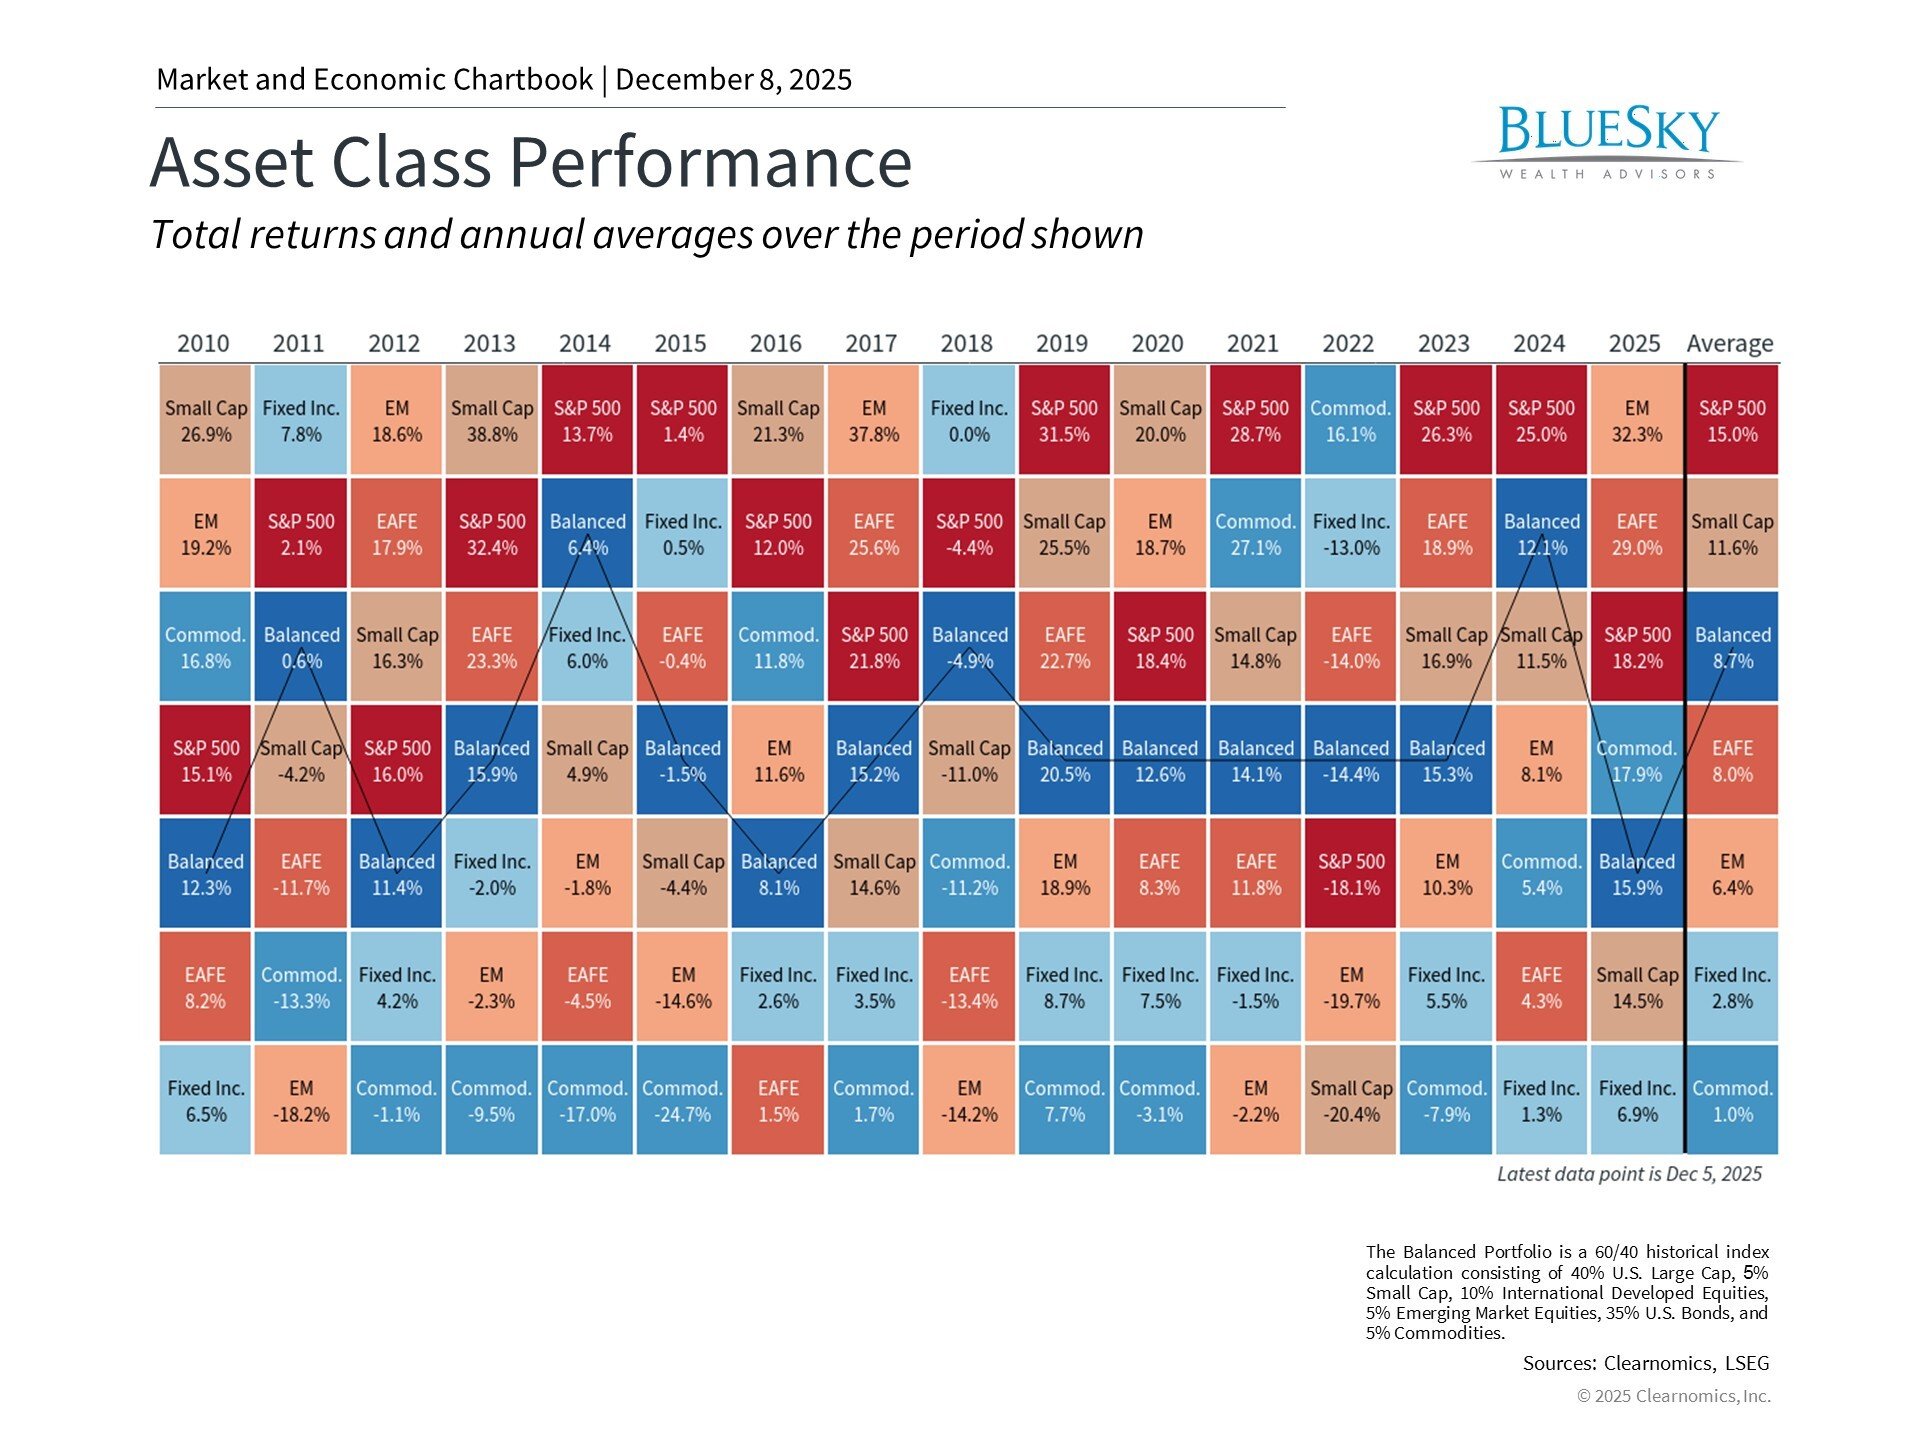
Despite recent tech sector dominance, historical data shows that numerous stocks have contributed to S&P 500 performance over extended periods, as illustrated in the accompanying chart.
Moreover, large companies haven't always led market returns. Historically, the largest companies, or "blue chips," were often viewed as conservative investments, primarily valued for their dividend stability.
While AI-focused stocks continue to generate significant investor interest, maintaining a broader market perspective is essential. If AI's impact matches expectations, its economic implications could surpass previous technological revolutions, benefiting well-diversified investors.
The bottom line? While tech sector weakness has raised concerns, maintaining portfolio discipline and broad market exposure remains crucial for long-term investment success.
BlueSky Disclosures
Copyright (c) 2025 Clearnomics, Inc. All rights reserved. The information contained herein has been obtained from sources believed to be reliable, but is not necessarily complete and its accuracy cannot be guaranteed. No representation or warranty, express or implied, is made as to the fairness, accuracy, completeness, or correctness of the information and opinions contained herein. The views and the other information provided are subject to change without notice. All reports posted on or via www.clearnomics.com or any affiliated websites, applications, or services are issued without regard to the specific investment objectives, financial situation, or particular needs of any specific recipient and are not to be construed as a solicitation or an offer to buy or sell any securities or related financial instruments. Past performance is not necessarily a guide to future results. Company fundamentals and earnings may be mentioned occasionally, but should not be construed as a recommendation to buy, sell, or hold the company's stock. Predictions, forecasts, and estimates for any and all markets should not be construed as recommendations to buy, sell, or hold any security--including mutual funds, futures contracts, and exchange traded funds, or any similar instruments. The text, images, and other materials contained or displayed in this report are proprietary to Clearnomics, Inc. and constitute valuable intellectual property. All unauthorized reproduction or other use of material from Clearnomics, Inc. shall be deemed willful infringement(s) of this copyright and other proprietary and intellectual property rights, including but not limited to, rights of privacy. Clearnomics, Inc. expressly reserves all rights in connection with its intellectual property, including without limitation the right to block the transfer of its products and services and/or to track usage thereof, through electronic tracking technology, and all other lawful means, now known or hereafter devised. Clearnomics, Inc. reserves the right, without further notice, to pursue to the fullest extent allowed by the law any and all criminal and civil remedies for the violation of its rights.
Recent Blog Posts: