Corporate Earnings Insights Into Tariff Impacts
Corporate Earnings Insights Into Tariff Impacts

Corporate earnings reports typically offer valuable insights into business performance, but this earnings season holds special significance given ongoing tariff considerations. Despite major indices hitting record highs amid improving trade relations, questions remain about tariff effects on consumers and companies. Encouraging developments include new trade agreements and corporate earnings that surpass analyst projections.
Recent data indicates robust consumer spending alongside corporate earnings growth that continues outpacing forecasts. The Yale Budget Lab reports consumers currently face an average effective tariff rate of 20.2% as of July 23, marking the highest level since 1911.1
The absence of this impact in consumer spending data suggests many companies are absorbing tariff costs rather than immediately transferring them to customers. This appears feasible due to strong earnings momentum and robust profit margins.
With more than one-third of S&P 500 companies reporting second-quarter results, 80% have exceeded earnings-per-share expectations, while the blended earnings growth rate of 6.4% has surpassed the anticipated 4.9%, per FactSet data.2
Although this growth rate trails recent quarters, it indicates an "earnings recession" – characterized by sharp profit declines like those in 2020 or 2022 – appears less probable than initially anticipated.
Corporate earnings are beating expectations so far

Understanding tariff payments and their potential appearance in financial data requires examining who bears the costs. While governments collect tariffs as revenue, the actual burden falls on either U.S. exporters or American consumers and businesses through elevated prices. The distribution between these groups depends on their respective "pricing power."
Consider rare earth metals essential for electronic devices – nearly all imported to the U.S. Given limited alternative sources, tariffs would likely transfer directly to consumers. This explains the administration's pursuit of expanded rare earth metal import agreements with China and increased focus on domestic production capabilities.
Conversely, the automotive sector features intense competition among domestic manufacturers and numerous countries seeking U.S. export opportunities. When tariffs target vehicles from specific countries, those manufacturers might absorb portions of the costs to maintain competitiveness against other nations' products and domestic alternatives.
Therefore, short-term tariff effects depend on industry competitiveness and available consumer and business alternatives. Over longer periods, supply chains can adapt to new circumstances while currency values adjust accordingly.
Consequently, tariff impacts on earnings and corporate responses vary significantly across industries. General Motors reported $1.1 billion in tariff-related profit losses during the second quarter, with margins declining from 9% to 6.1%.3
Conversely, Cleveland-Cliffs, a domestic flat-rolled steel producer, announced second-quarter earnings exceeding expectations, benefiting from tariffs that reduced steel imports.4
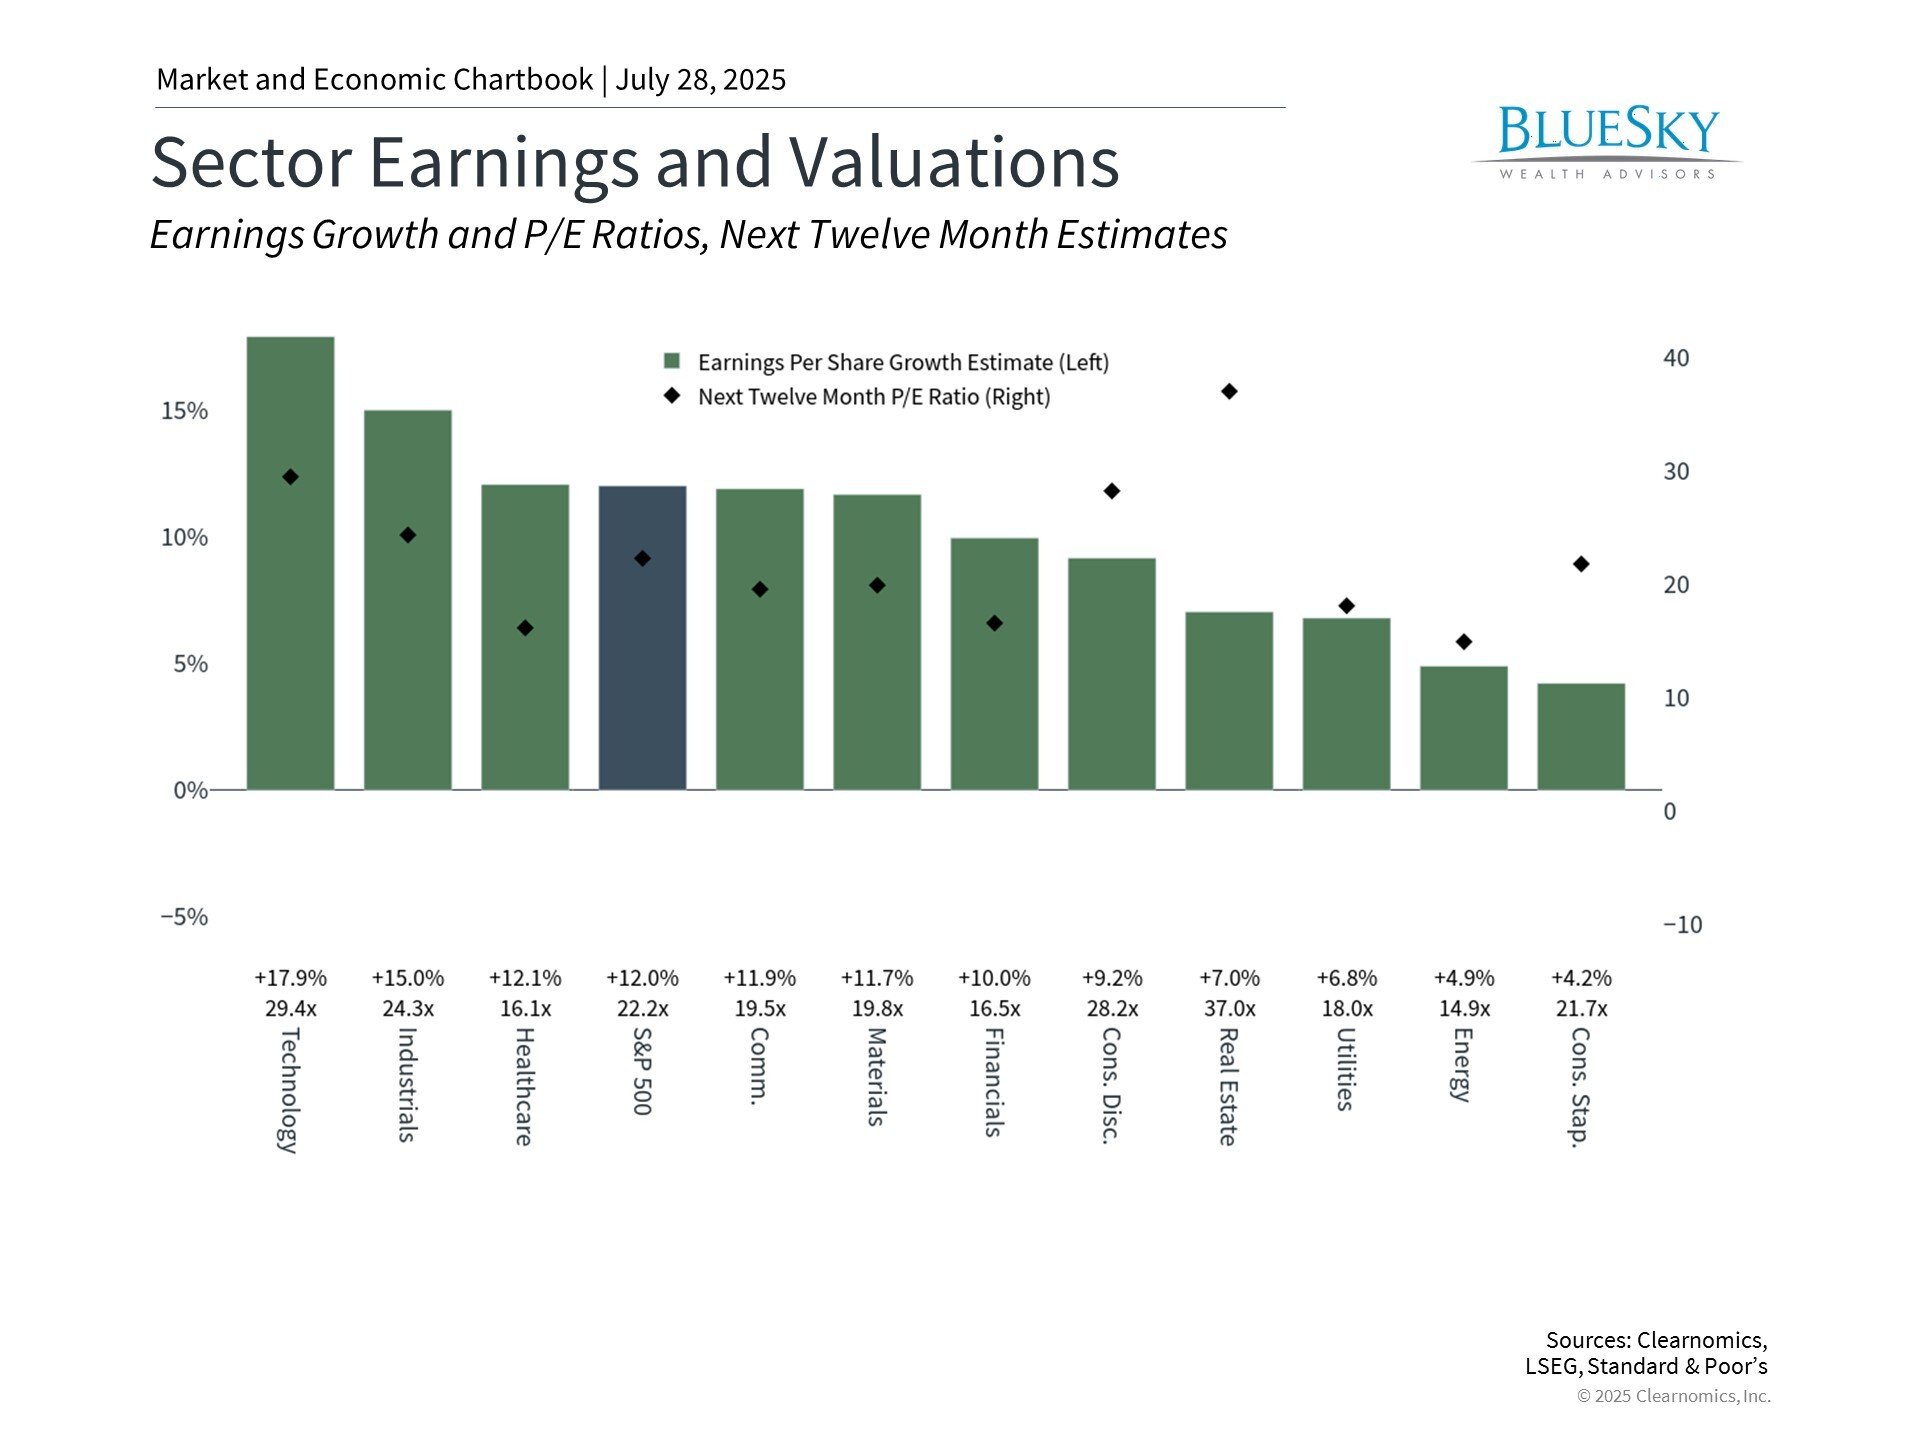
The accompanying chart demonstrates how earnings expectations differ substantially across sectors, partially reflecting trade impacts. Understanding tariffs' complete effects on companies may require several quarters, particularly as new trade agreements emerge.
Multiple countries have established new arrangements, some featuring considerably lower tariffs than those initially declared April 2. Recent announcements indicate the European Union and Japan will face 15% tariffs on U.S. exports, while Indonesia and the Philippines encounter 19% rates. Meanwhile, China discussions continue following earlier trade truce developments.
Markets continue to reach new all-time highs

Financial markets have sustained their climb to record levels as earnings surprises and new trade agreements emerge. The chart demonstrates the S&P 500 achieving over twelve new peaks this year, with most occurring within the past month. The Nasdaq has similarly reached historic levels, surpassing its previous December record, while the Dow approaches new territory. Though current levels may concern some investors, major indices typically establish numerous records annually during expansion periods.
Strong market performance continues despite persistent concerns about tariff economic impacts. Various economic projections, including Federal Reserve forecasts, suggest slightly elevated inflation and modestly reduced growth. Industry impacts will vary based on input costs, with import-dependent sectors facing compressed margins. However, these projections must balance against domestic investment benefits and companies' adaptive capabilities through innovation and efficiency improvements.
While tariffs remain historically elevated, their predictability matters more, as stable business environments enable more effective operational and supply chain adaptations. Looking ahead, Wall Street consensus projects S&P 500 earnings growing at 9.5% annually. These forecasts anticipate accelerating growth over the next two years as global trade stabilizes, though conditions could change significantly.
Earnings are an important long-term driver of returns

Stock markets generally track corporate earnings over extended periods. The chart reveals that while S&P 500 prices and earnings don't align perfectly, they follow similar broad trajectories. This occurs because economic expansion drives earnings growth, which subsequently elevates stock prices. Although the economy and stock market aren't identical, they connect closely through corporate performance.
This relationship explains how tariff profit impacts can affect investors. Market valuations as "cheap" or "expensive" depend on both stock prices and corporate performance. The price-to-earnings ratio simply divides stock or index prices by earnings measures, such as projected twelve-month earnings.
This means rising earnings make markets more attractive even without price changes, and vice versa. The current S&P 500 price-to-earnings ratio stands at 22.2x, significantly above the historical 15.8x average and approaching the dot-com bubble peak of 24.5x. While current earnings trends appear positive, continued market attractiveness will depend on economic growth and earnings performance.
The bottom line? This earnings season may illuminate tariff effects on consumers and businesses. For investors, understanding these developments while maintaining long-term planning focus remains the optimal approach to achieving financial objectives.
- https://budgetlab.yale.edu/research/state-us-tariffs-july-23-2025
- https://insight.factset.com/topic/earnings
- https://investor.gm.com/static-files/eaf4a73f-ef85-4134-8533-902e6a9a8177
- https://www.clevelandcliffs.com/investors/news-events/press-releases/detail/678/cleveland-cliffs-reports-second-quarter-2025-results
BlueSky Disclosures
Copyright (c) 2025 Clearnomics, Inc. All rights reserved. The information contained herein has been obtained from sources believed to be reliable, but is not necessarily complete and its accuracy cannot be guaranteed. No representation or warranty, express or implied, is made as to the fairness, accuracy, completeness, or correctness of the information and opinions contained herein. The views and the other information provided are subject to change without notice. All reports posted on or via www.clearnomics.com or any affiliated websites, applications, or services are issued without regard to the specific investment objectives, financial situation, or particular needs of any specific recipient and are not to be construed as a solicitation or an offer to buy or sell any securities or related financial instruments. Past performance is not necessarily a guide to future results. Company fundamentals and earnings may be mentioned occasionally, but should not be construed as a recommendation to buy, sell, or hold the company's stock. Predictions, forecasts, and estimates for any and all markets should not be construed as recommendations to buy, sell, or hold any security--including mutual funds, futures contracts, and exchange traded funds, or any similar instruments. The text, images, and other materials contained or displayed in this report are proprietary to Clearnomics, Inc. and constitute valuable intellectual property. All unauthorized reproduction or other use of material from Clearnomics, Inc. shall be deemed willful infringement(s) of this copyright and other proprietary and intellectual property rights, including but not limited to, rights of privacy. Clearnomics, Inc. expressly reserves all rights in connection with its intellectual property, including without limitation the right to block the transfer of its products and services and/or to track usage thereof, through electronic tracking technology, and all other lawful means, now known or hereafter devised. Clearnomics, Inc. reserves the right, without further notice, to pursue to the fullest extent allowed by the law any and all criminal and civil remedies for the violation of its rights.


